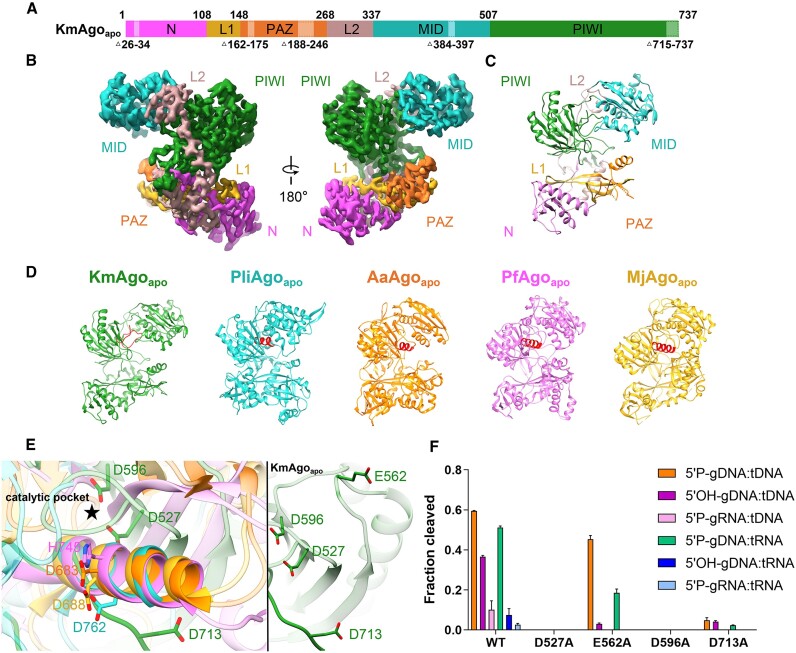
Figure 1.
The overall structure of KmAgoapo. (A) The primary structure of KmAgoapo with amino acid numbering. Domains and their unstructured residues are colored and labeled. (B, C) Cryo-EM density map (B) and ribbon diagrams (C) of KmAgoapo, with domains colored as in (A). (D) Structural comparison of the apo form of KmAgo, PliAgo (PDB: 7R8F), AaAgo (PDB: 1YVU), PfAgo (PDB: 1U04) and MjAgo (PDB: 5G5S). The structures were superimposed onto each other, focusing on their C-terminal regions, which were subsequently highlighted in red. (E) (left) A magnified view comparing the C-terminal regions of KmAgoapo with other pAgo structures, as depicted in (D). (right) A magnified view of catalytic tetrad in KmAgoapo from the same perspective. Color schemes are indicated by the labels. (F) Cleavage activity of the catalytic site mutants of KmAgo. Average cleavage efficiencies were plotted from three technical replicates. Error bars represent the standard deviations.

