Figure 2.
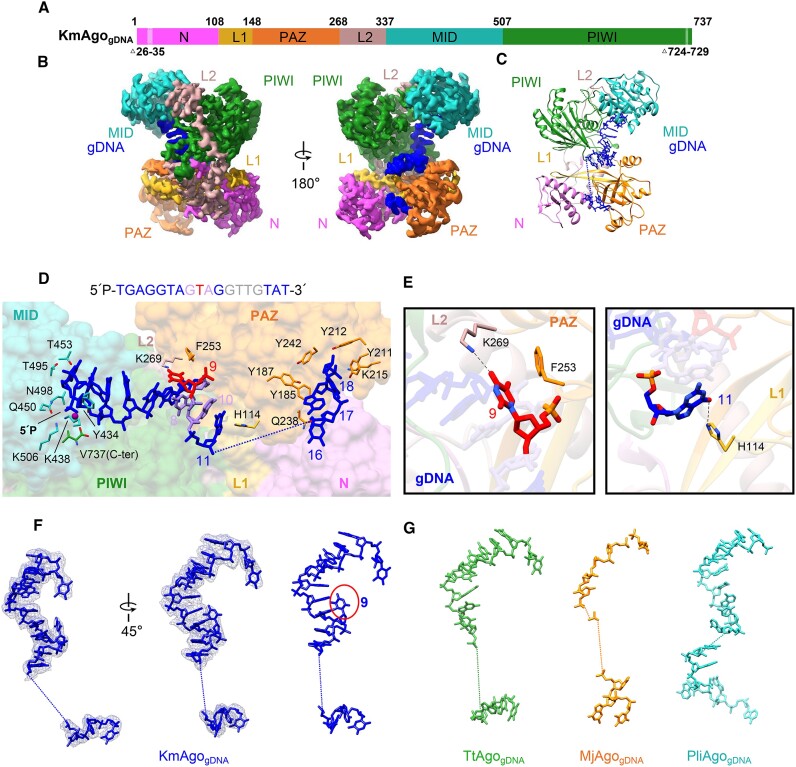
The overall structure of KmAgogDNA. (A) The primary structure of KmAgogDNA with amino acid numbering. Domains and their unstructured residues are colored and labeled. (B, C) Cryo-EM density map (B) and ribbon diagrams (C) of KmAgogDNA, with domains colored as in (A). The density of guide DNA is indicated by a blue color. (D) (Top) 5′P-gDNA sequence within the binary complex. Unmodelled segments were highlighted in gray. (Bottom) A magnified representation of the interactions between KmAgo and 5′P-gDNA. KmAgo is represented as a semi-transparent surface. The amino acid residues crucial for guide positioning, along with the nucleotides, are labeled and represented using stick models. (E) Detailed interactions at the guide strand T9 and G11. (F) Structure of the guide DNA in KmAgo-gDNA, displayed with cryo-EM density shown in mesh. The kink at position 9 is marked with a red circle. (G) Structure of the guide DNA in TtAgo-gDNA (PDB: 3DLH), MjAgo-gDNA (PDB: 5G5T) and PliAgo-gDNA (PDB: 7R8H) binary complex.

