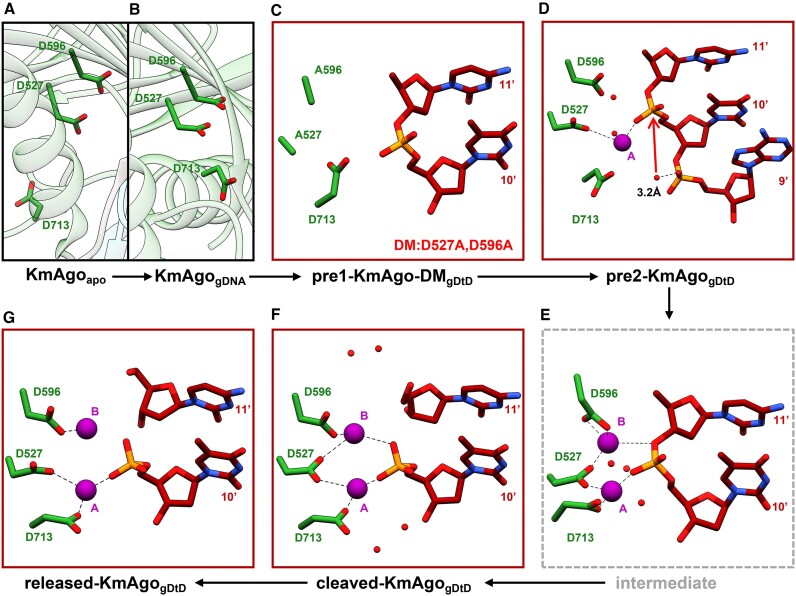
Figure 5.
Conformational changes of the catalytic center. Cryo-EM structure snapshots (A–D, F–G) and a molecular dynamics simulation model of the intermediate state (E) in the cleavage cycle of KmAgo are presented. The pair of Mn2+ cations are labeled and depicted as magenta spheres. Water molecules are represented as red spheres. The three catalytic residues D527, D596 and D713 are shown in stick representation. The red arrow in (D) indicates the nucleophilic attack. 3.2 Å refers to the distance from the attacking water molecule to the non-bridging phosphate oxygen.

