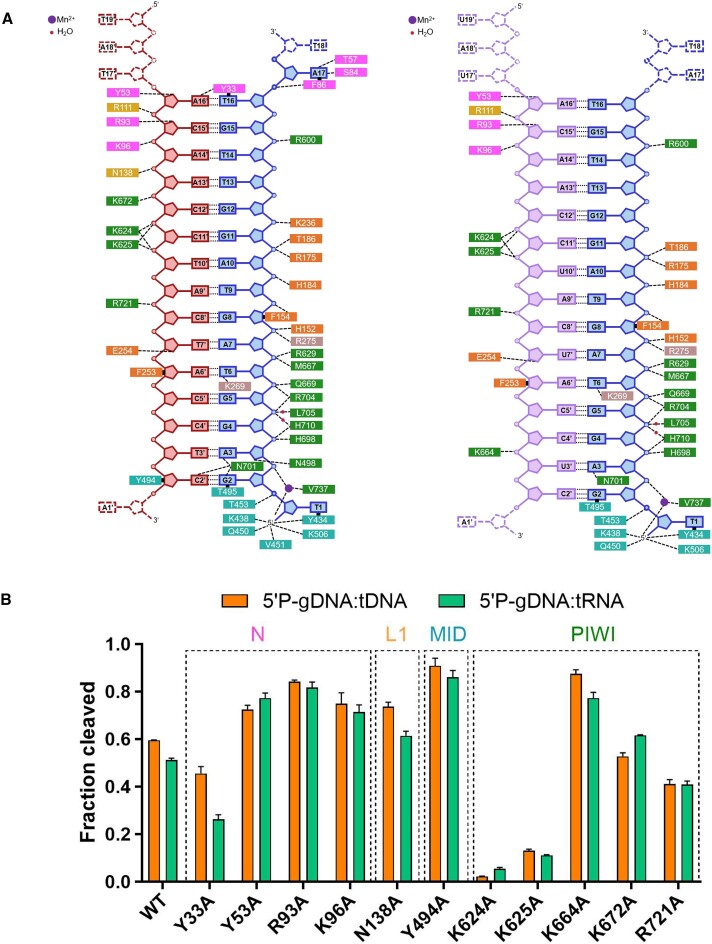
Figure 7.
Comparison of the major contacts in KmAgo-DM ternary complexes. (A) (Left) Schematic representation of the primary interactions between KmAgo-DM and gDNA (blue) and tDNA (red). (Right) Schematic representation of the primary interactions between KmAgo-DM and gDNA (blue) as well as tRNA (purple). The residues are colored according to their domains, similar to the representation in Figure 6A. (B) Mutational analysis of amino acid residues interacting with targets. Average cleavage efficiencies were plotted from three technical replicates. Error bars represent the standard deviations.

