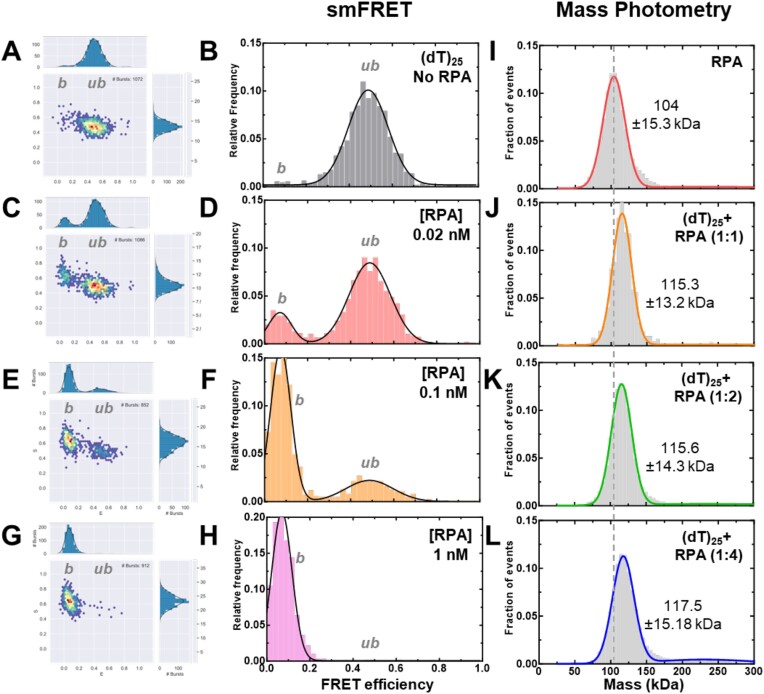
Figure 3.
Concentration dependence of RPA–ssDNA complexes. A-H) FRET analysis of (dT)25 ssDNA bound to increasing concentrations of RPA show a shift from the unbound to bound complex. As RPA concentrations are increased, a complete shift to the bound population is observed. Ratios are defined as one molecule of ssDNA: number of RPA trimers (molar ratio). I-L) Mass photometry analysis of RPA and RPA-(dT)25 complexes show formation of predominantly single RPA bound (dT)25 complexes. The dotted line serves as a reference point for the mass of free RPA in solution as seen in panel I. The measured mass for RPA and the RPA-DNA complexes (1:1 stoichiometry) are noted. In all conditions tested here, one RPA molecule binds to one molecule of ssDNA.

