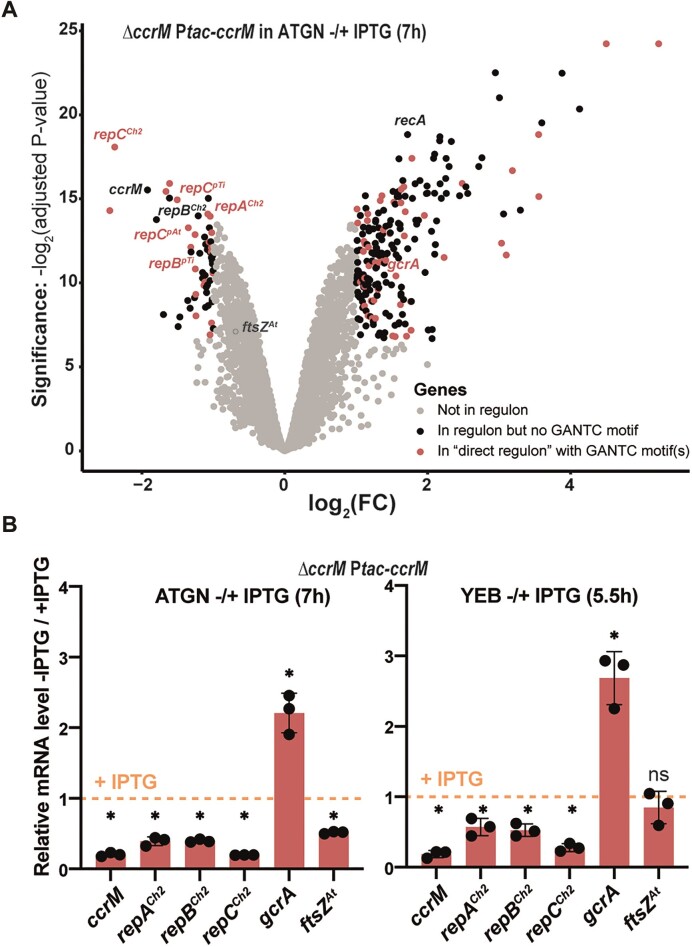
Figure 3.
Depletion of CcrM has a major impact on the A. tumefaciens transcriptome in cells cultivated for 7 hours in minimal medium. (A) Volcano plot showing RNA-Seq results and analyses comparing the transcriptome of exponentially growing JC2307 (ΔccrM Ptac-ccrM) cells cultivated in ATGN ± IPTG for 7 h (same cultures as those used for methylome experiments described in Figure 1B). FC indicates the fold-change when comparing the - IPTG condition with the + IPTG condition. Each dot corresponds to a gene. Grey dots correspond to genes that are not considered as differentially regulated (= FC < 2 or adjusted P-value > 0.01). Black dots correspond to 198 genes that are differentially regulated (FC > 2 and adjusted P-value < 0.01) but that do not contain a GANTC motif in the 200 bp region upstream of the ORF. Red dots correspond to the 75 genes that are differentially regulated (FC > 2 and adjusted P-value < 0.01) and that do contain minimum one GANTC motif in the 200 bp region upstream of the ORF (‘direct regulon’). The precise identity/annotation/COG category/GANTC motif locations for all genes can be found in Supplementary Tables S4 and S5. A Glimma Volcano Plot (interactive HTML graphic) is also available in the supplementary information. Adjusted P-values were calculated based on three independent biological replicates for each strain/growth condition. (B) qRT-PCR results confirming the impact of CcrM on the expression of a selection of genes in JC2307 (ΔccrM Ptac-ccrM) cells cultivated in minimal (left) and complex (right) media. The graphs show relative mRNA levels in cells cultivated without the IPTG inducer, compared to cells cultivated with the IPTG inducer (then set to an arbitrary value of 1 for each gene = orange dotted line). The same RNA samples as those used in (A) were used for the ‘ATGN ± IPTG (7 h)’ panel. RNA samples used for the ‘YEB ± IPTG (5.5 h)’ panel were prepared from JC2307 cells pre-cultured in ATGN + IPTG and then diluted into YEB + IPTG for growth until exponential phase. Cells were then washed and resuspended into YEB ± IPTG at Time 0. RNA samples were prepared after 5.5 h of growth. For both panels, three biological replicates with three technical replicates each were used. Significant differences (Wilcoxon rank sum test) when comparing – IPTG / + IPTG are indicated by * (P< 0.0001). ns: not significant (P-value > 0.05).

