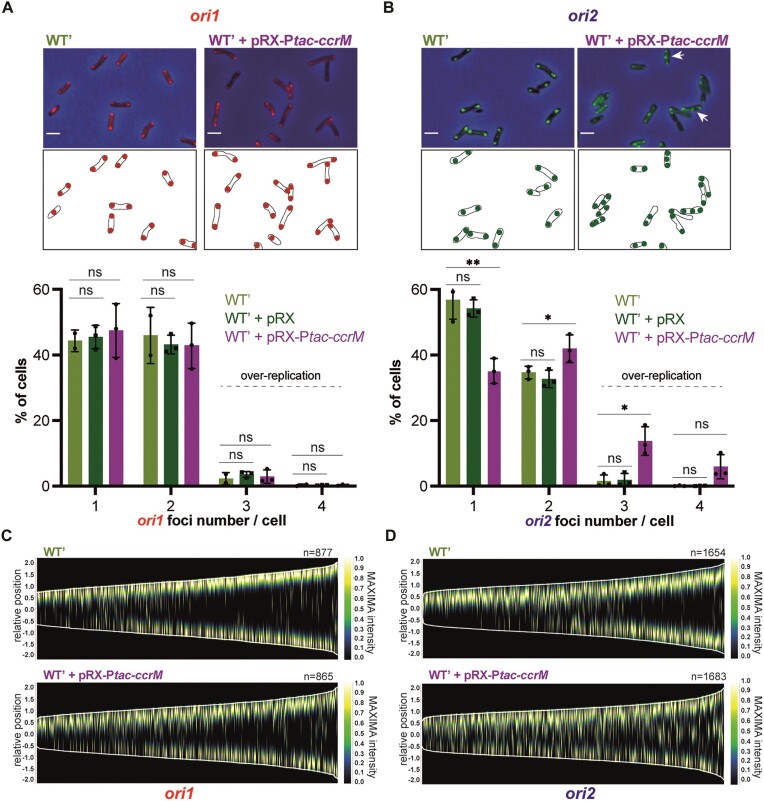
Figure 5.
Overexpression of CcrM results in hyper-initiation events at ori2 in cells cultivated in minimal medium. (A) and (B) selected microscopy images of JC2656 (WT' with ori1/ygfp reporter) cells (panel A) or JC2657 (WT' with ori2/ygfp reporter) carrying or not the pRX-Ptac-ccrM vector. Cells were cultivated over-night in ATGN + IPTG. Cultures were then diluted into ATGN + IPTG and grown exponentially for ∼6.5 h. Upper panels: overlays of phase contrast and YGFP images. Lower panels: schematics showing ori1 (red color in (A)) or ori2 (green color in (B)) subcellular localization in the cells imaged above. Under these microscopy images, plots show the proportion of cells with the indicated number of ori1 (in (A)) or ori2 (in (B)) foci for each strain (pRX is the empty control vector). Minimum two independent experiments (with a total of minimum 1000 cells) were done for each strain with each dot corresponding to an independent experiment and mean values were plotted with error bars corresponding to standard deviations. Student's t-test: ns = P-value > 0.05, * = P-value < 0.05, ** = P-value < 0.01. (C, D) Demographs showing the subcellular localization of ori1 (panel c) or ori2 (panel d) foci as a function of cell size (from images as shown in panels (A) and (B)). Relative position = 0 corresponds to mid-cell; only cells measuring from 1 to 4 μm-long were included into these demographs; n = number of cells used to construct each demograph.

