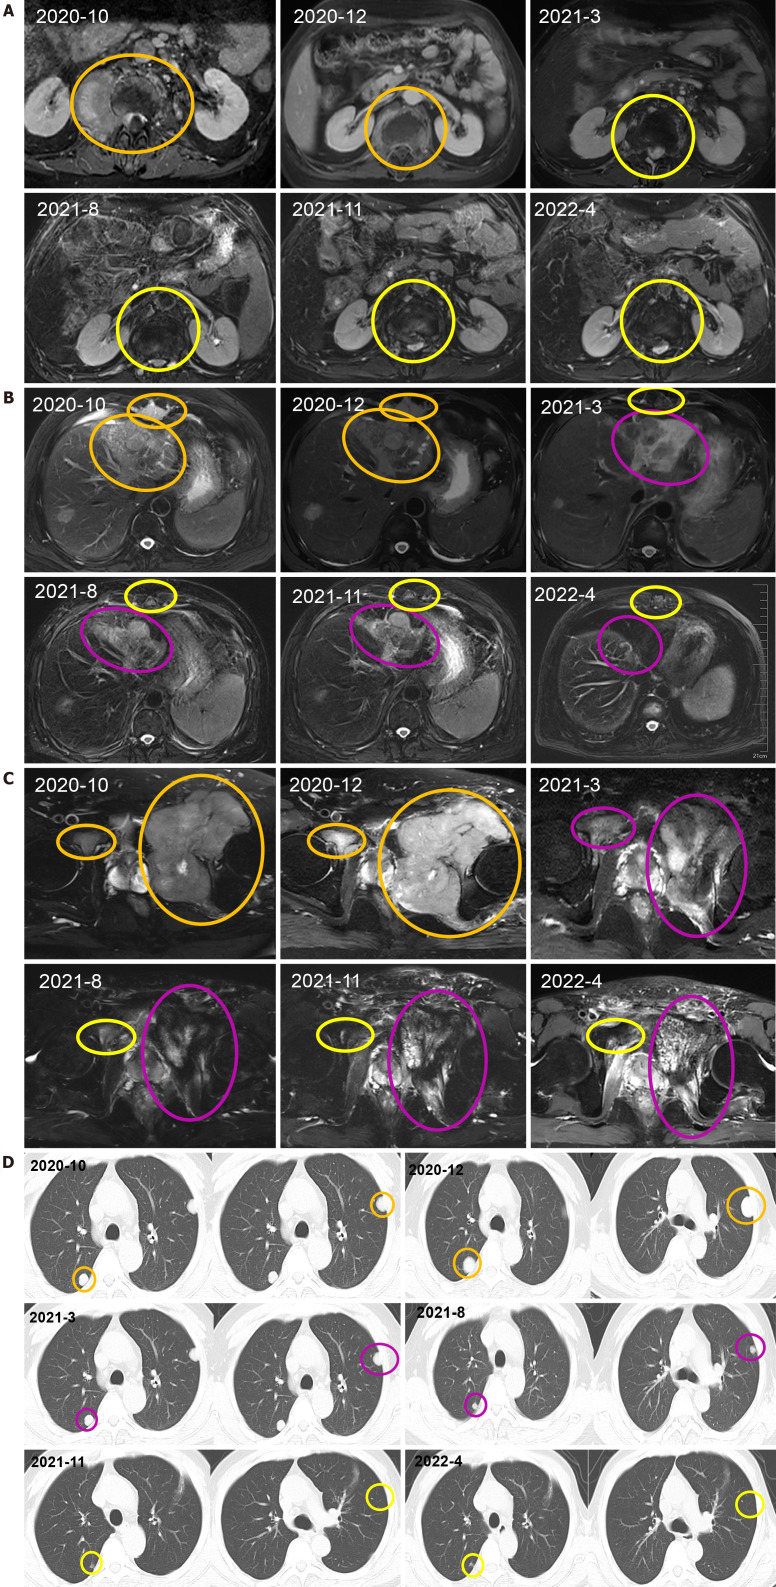
Figure 3.
The primary tumor and metastatic lesions before and after therapy. A: Vertebral body and right paravertebral mass observed via computed tomography (CT) scan; B: Liver, abdominal lymph nodes, intrahepatic lesions observed via CT scan; C: sacrum, left and right iliac bones, left iliac fossa observed via CT scan; D: CT scan of the thorax showing a nodular shadow in both lungs. All the mass was measured at the level of branching of the main pulmonary artery. The therapeutic effect was evaluated as progressive disease or stable disease are marked in orange, complete response is marked in yellow and partial response is marked in purple.

