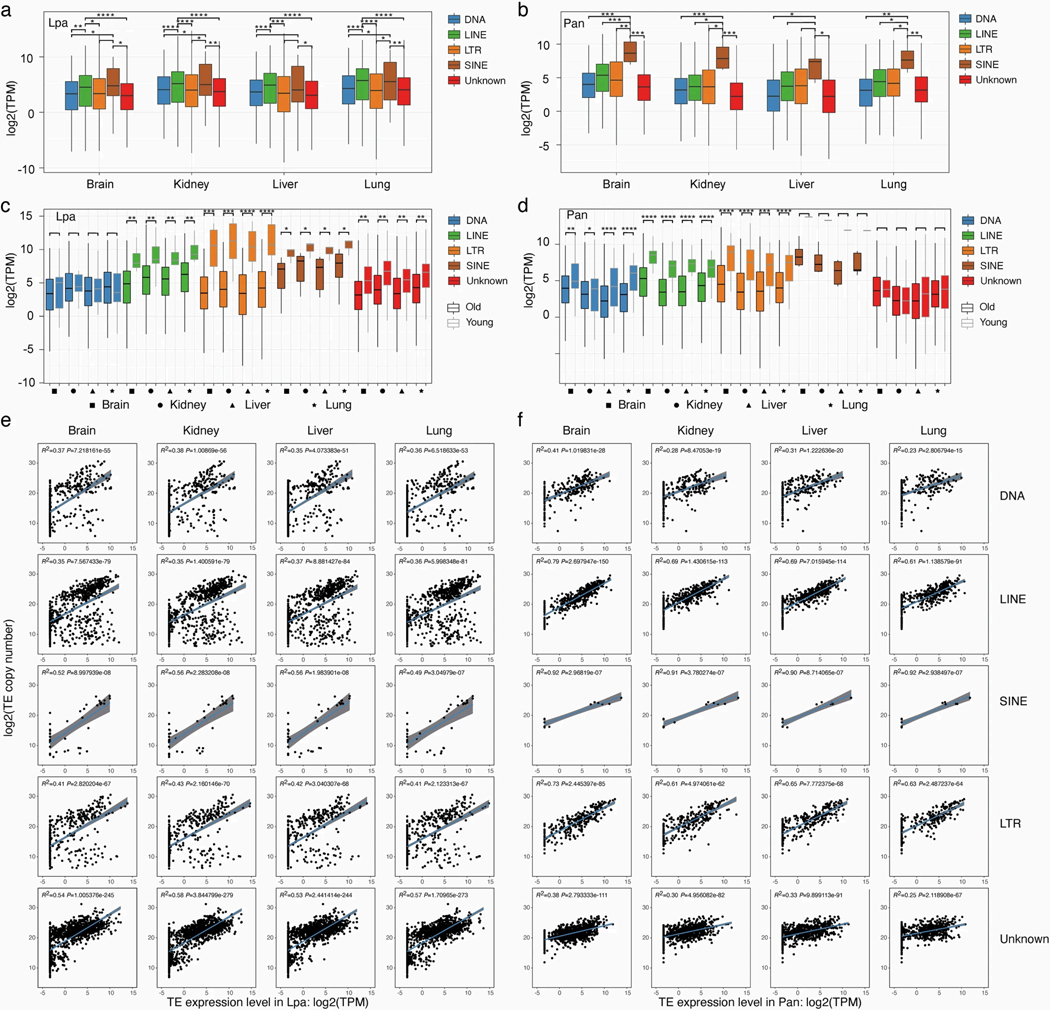
Extended Data Fig. 4: Expression of transposable element families.
a, b, Expression estimated for each transposable element family from poly (A)-enriched RNA-seq data. In all tissues, SINEs are more highly expressed than any other subclass in the African lungfish, while both LINEs and SINEs are slightly more expressed than any other subclass in the South American lungfish. n = 2029 (African lungfish) and 1897 (South American lungfish) transposable element families. Wilcoxon Signed Ranks Test (one-sided) was applied with * indicating p-value < 0.05, ** p-value < 0.005, *** p-value < 0.0005 and **** p-value < 0.00005. The box bounds the interquartile range divided by the median value, with the whiskers extending to a maximum of 1.5 times the interquartile range beyond the box. c, d, Higher expression of young transposable element families. When transposable element families are divided into young or old copies based on Kimura 2-parameter distance to consensus values (0–10% is young, >10% is old), young TEs are significantly higher expressed than old ones, suggesting that several types of TEs remain active and contribute to the ongoing expansion of the lungfish genomes. Out of the 13 SINE families of Protopterus annectens, only copies from the SINE/t-RNA-V-RTE are considered as young. e, f, | Correlation between expression of transposable element families and copy number. Expression was estimated for each transposable element family using poly (A)-enriched RNA-seq data. For all tissues and transposable element classes, a positive correlation is observed between expression level and copy number. When a transposable element family is highly expressed, this family tends to have more copies. All analyzed correlations are significantly positive (p-values < 0.001). A linear model estimated trend line and calculated 95% confidence interval around the trend (gray fill) are plotted (two-sided). Lpa, Lepidosiren paradoxa; Pan, Protopterus annectens.

