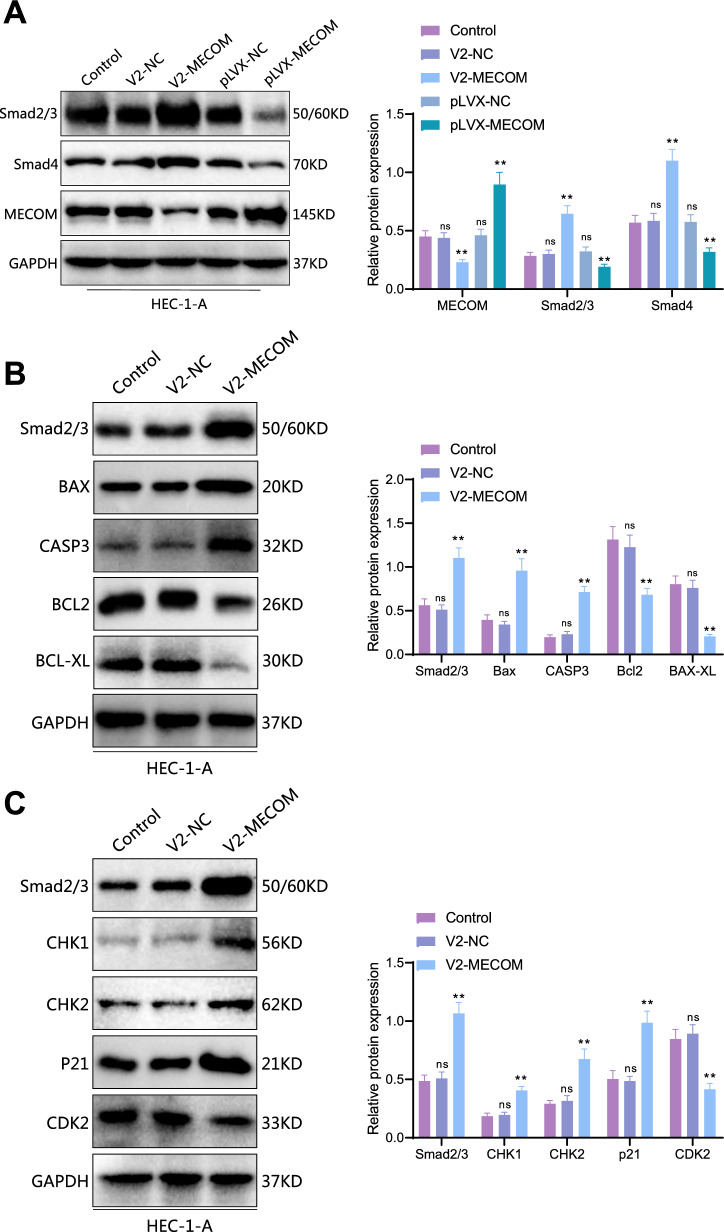
Fig. 8.
Impact of MECOM Regulation of Smad Proteins on Apoptosis and Cell Cycle Regulation in HEC-1-A Cells. A Western blot analysis of changes in Smad protein levels after MECOM knockout and overexpression. The left image shows the changes in Smad protein levels in HEC-1-A cells after MECOM knockout and overexpression. The right chart shows the quantitative analysis (Compared to the Control group, ****p < 0.0001; ns: insignificant). B Western blot analysis of the impact of MECOM knockout on apoptosis-related proteins. The left image shows the protein expression levels of BAX, caspase-3 (CASP3), Bcl-2, and Bcl-xL in the control group (Control), empty vector control group (V2-NC), and MECOM knockout (V2-MECOM). The right chart is the quantitative analysis of the corresponding proteins, showing a significant increase in the expression of Smad2/3, BAX, and caspase-3 in cells with MECOM knockout, while the expression of Bcl-2, Bcl-xL significantly reduced (Compared to the Control group, ****p < 0.0001; ns: not significant). C Western blot analysis of the impact of MECOM knockout on cell cycle regulatory proteins. The left image shows the protein expression levels of CHK1, CHK2, p21, and CDK2 in the control group (Control), empty vector control group (V2-NC), and MECOM knockout (V2-MECOM). The right chart is the quantitative analysis of the corresponding proteins, showing a significant increase in the expression of Smad2/3, CHK1, CHK2, and p21 in cells with MECOM knockout, while the expression of CDK2 significantly reduced (Compared to the Control group, ****p < 0.0001; ns: not significant). All cell experiments were repeated three times

