Figure 1.
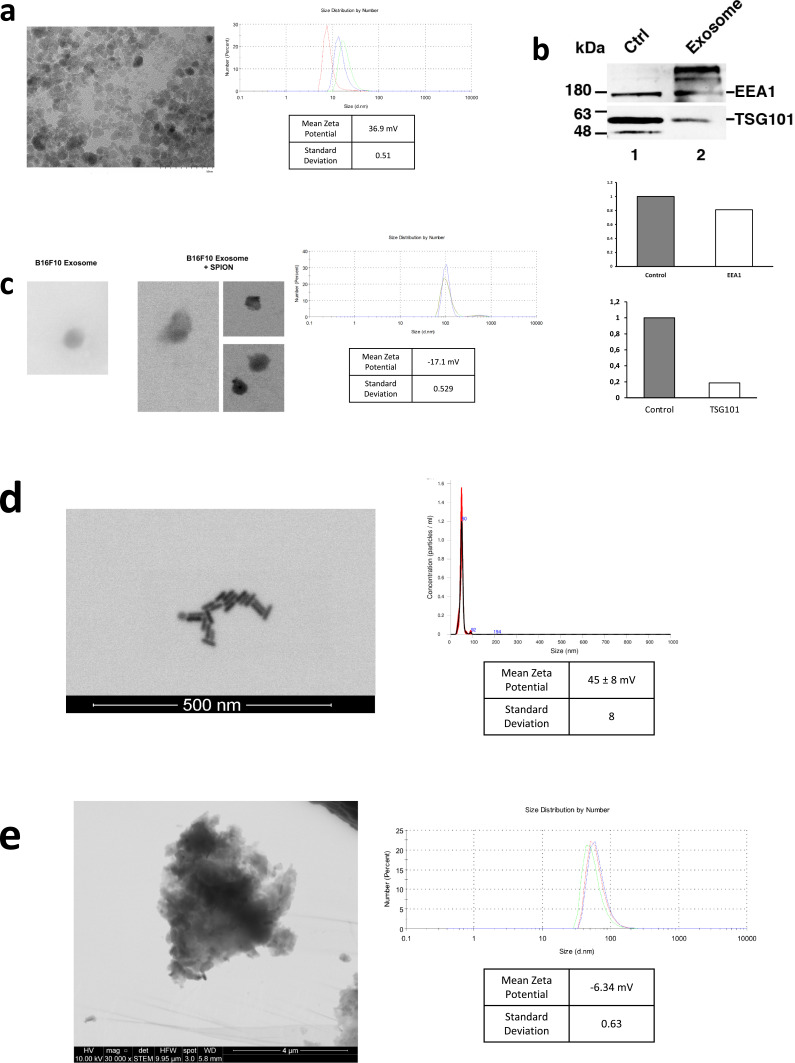
Characterization of nanoparticles. (a) STEM visualization of SPIONs; size distribution and zeta potential measured by DLS. (b) Western blot of EV markers EEA1 and TSG101 on exosomes from the B16F10 melanoma cell line. Control was performed using a cellular extract from the B16F10 cell line. Quantification of EEA1 and TSG101 with respect to control is shown. (c) STEM visualization of exosomes with and without SPIONs labeling; size distribution and zeta potential measured by DLS. (d) STEM visualization of gold nanorods; size distribution measured by NTA and zeta potential determined by DLS. (e) STEM visualization of Chinese ink; size distribution and zeta potential measured by DLS.

