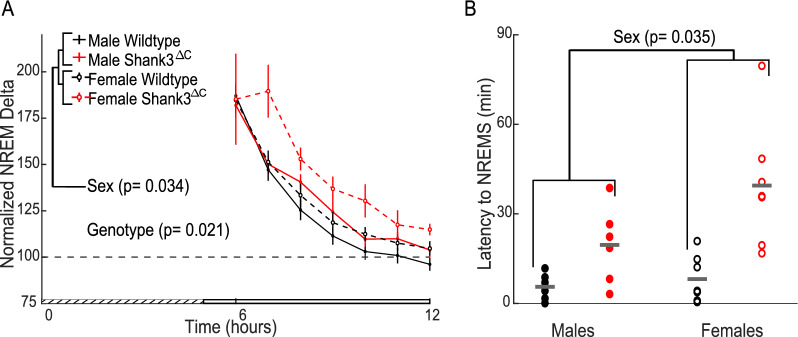
Fig. 3.
Shank3ΔC mice have an increase in latency to sleep despite similar accumulation of sleep pressure following sleep deprivation. A Hourly NREM sleep delta power (0.5–4 Hz) after SD. Main effect of sex and genotype shown from initial repeated measures ANOVA. Error bars represent SEM, grated area represents the five hours of SD. B NREM sleep onset latency following SD. Mean value represented in gray bar. Repeated measures ANOVA main effect of sex shown in figure, main effect of genotype p = 1.614E -04, post hoc unpaired t-test with Benjamini–Hochberg correction: males across genotype p = 0.037 (WT: 5.6 ± 1.5 min; Mutant: 19.6 ± 5.2 min), females across genotype p = 0.012 (WT: 8.2 ± 3.0 min; Mutant: 39.5 ± 7.9 min). WT represented in black, Shank3ΔC mutants represented in red (n = 7 WT males, 7 WT females, 6 Shank3ΔC males, 7 Shank3ΔC females). Values in parentheses are mean ± SEM

