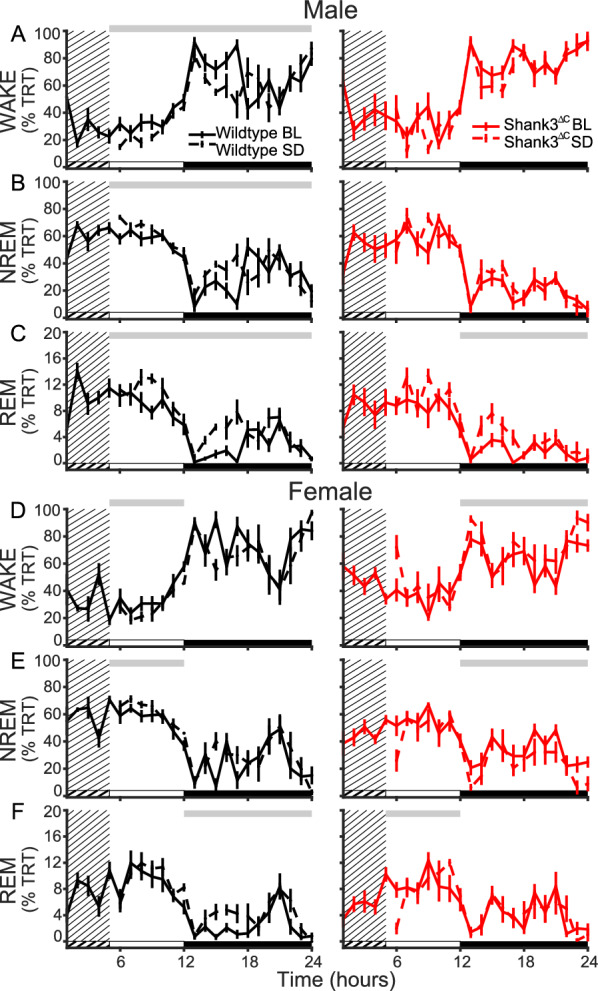
Fig. 4.

Shank3ΔC mice lack a homeostatic response to SD. Total recording time (TRT) in wake (top row), NREM sleep (middle row) and REM sleep (bottom row) in recovery sleep compared to baseline. A–C Males. D–F Females. Gray bar above plots represents significance from repeated measures ANOVA across hour 6–12 (light period) or 13–24 (dark period). Light period represented by white bar, dark period black bar. Dashed line represents recovery sleep day, solid line represents baseline day, grated area represents the five hours of SD. WT represented in black, Shank3ΔC mice represented in red (n = 7 WT males, 7 WT females, 6 Shank3ΔC males, 7 Shank3ΔC females). A WT light period for treatment F (6, 12) = 31.678, p = 1.110E-04, WT dark period for treatment *time F (11, 12) = 3.446, p = 3.078E-04. B WT NREM sleep light period for treatment F (6, 12) = 21.965, p = 001, WT NREM sleep dark period for treatment*time F (11, 12) = 3.313, p = 4.800E-04. C WT light period for treatment F (6, 12) = 8.007, p = 0.015, WT dark period for treatment F (11, 12) = 10.294, p = 0.008. Shank3ΔC dark period for treatment F (11, 11) = 9.332, p = 0.011. D WT light period for treatment F (6, 11) = 4.896, p = 0.047. Shank3ΔC dark period for treatment F (11, 12) = 6.128, p = 0.029. E WT light period for treatment F (6, 11) = 4.964, p = 0.046. Shank3ΔC dark period for treatment F (11, 12) = 8.293, p = 0.014. F WT dark period for treatment F (6, 11) = 15.901, p = 0.002, Shank3ΔC light period for treatment*time F (11, 12) = 2.332, p = 0.041
