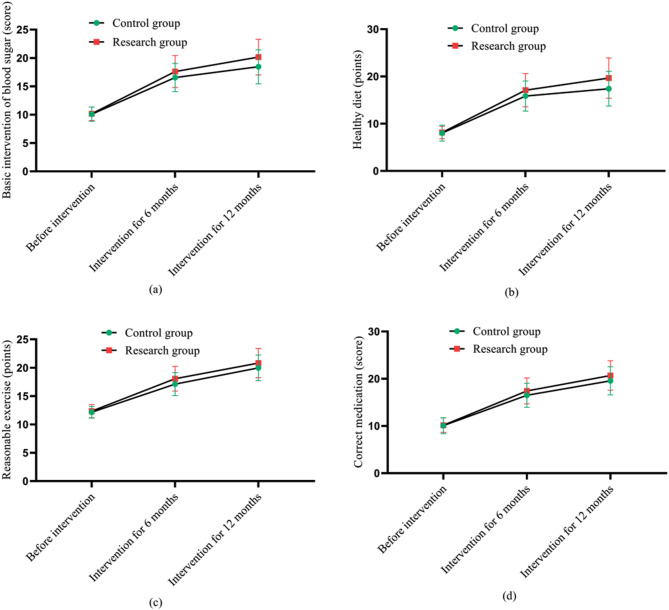
Fig. 1.
Cognitive score of disease related knowledge before intervention, 6 and 12 months of intervention. Note: (a) shows the basic intervention indicators for blood sugar; Fig. 1 (b) shows the indicators for healthy diet; Fig. 1 (c) shows the indicators for reasonable exercise; Fig. 1 (d) shows the indicators for correct medication; Among them, the pink hexagon is the research group and the green quadrilateral is the control group; The ups and downs of the curve indicate the changes in the levels of various indicators before and after intervention

