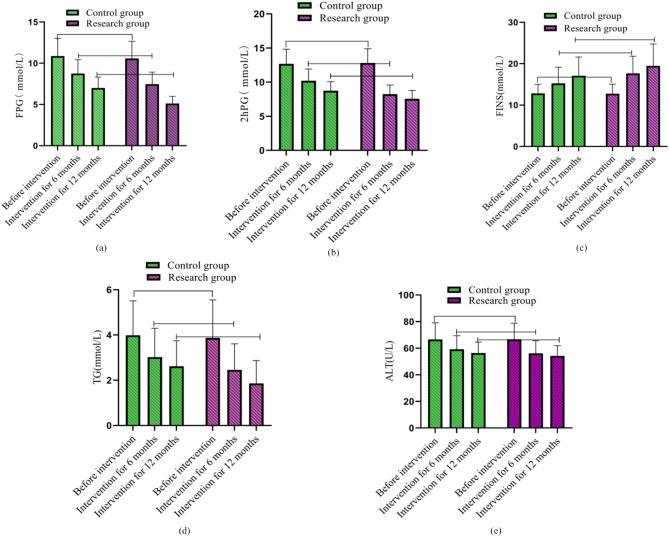
Fig. 2.
Comparison of changes in blood glucose, blood lipids, and liver function levels before intervention, 6 and 12 months after intervention. Note: (a), (b), (c) with (d) and (e) shows the FPG indicator, 2hPG indicator, TG indicator, and ALT indicator, respectively. Among them, the green column combined with a circular shape is used as the control group, while the green cylinder combination is the control group and the purple square column combination is the research group. The columnar fluctuation indicates the changes in the levels of various indicators before and after intervention

