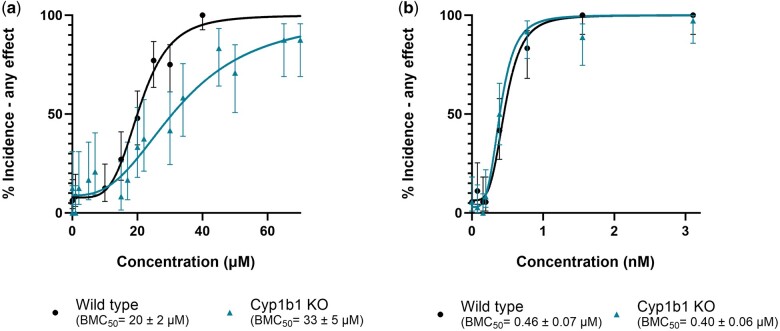
Fig. 11.
Concentration–response curves for percent incidence of any morphological effect observed after exposure to (a) retene and (b) TCDD in 5D and Cyp1b1wh4 fish. Percent incidence of any effect values are the percent effect in 36 replicate fish for TCDD exposure and 24 replicate fish for retene exposure. Observed effect is displayed with 95% confidence intervals. BMC50 values include the 95% confidence intervals.

