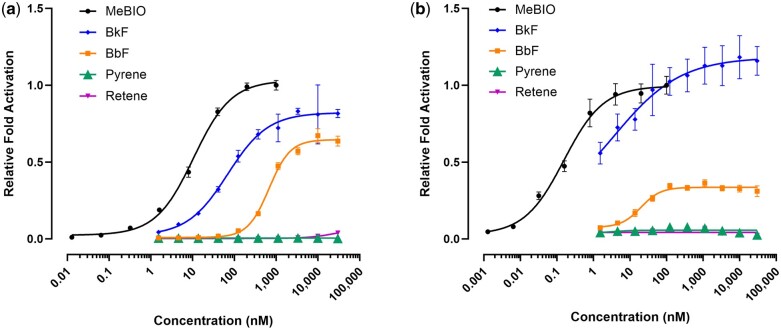
Fig. 2.
Concentration–response curves for luciferase production representative of AHR activation in (a) Human Huh-7 and (b) Zebrafish ZF-4 cells. Each point is the result of 3 replicate wells. Error bars indicate 95% confidence intervals. Fold activation values for all compounds tested, including those not shown here, are in Table S4.

