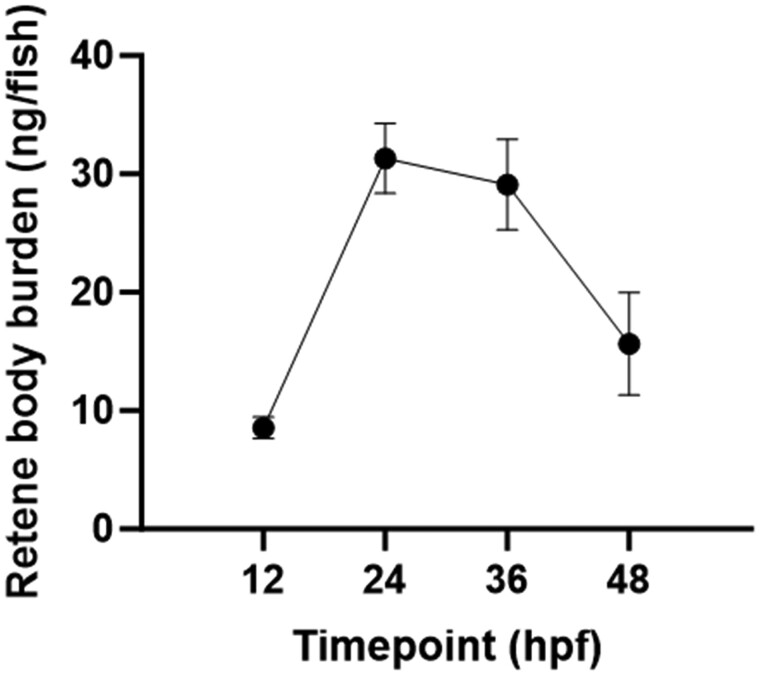
Fig. 3.
Retene mass detected in zebrafish tissue extracts at 4 developmental timepoints after static exposure to 30 μM retene in 96 well plates beginning at 6 hpf. Each point represents the average mass of retene per fish determined from 4 replicates each consisting of extracts from 40 exposed embryos. Error bars indicate the 95% confidence intervals.

