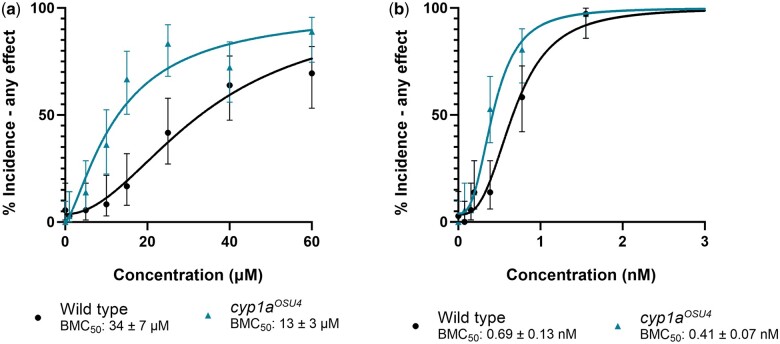
Fig. 9.
Concentration-response curves for percent incidence of any mortality or morphological effect intervals observed after exposure to (a) retene and (b) TCDD in wild-type and cyp1aosu4 fish. Percent incidence of any effect values are the percent effect in 36 replicate fish and displayed with 95% confidence intervals. BMC50 values include the 95% confidence intervals.

