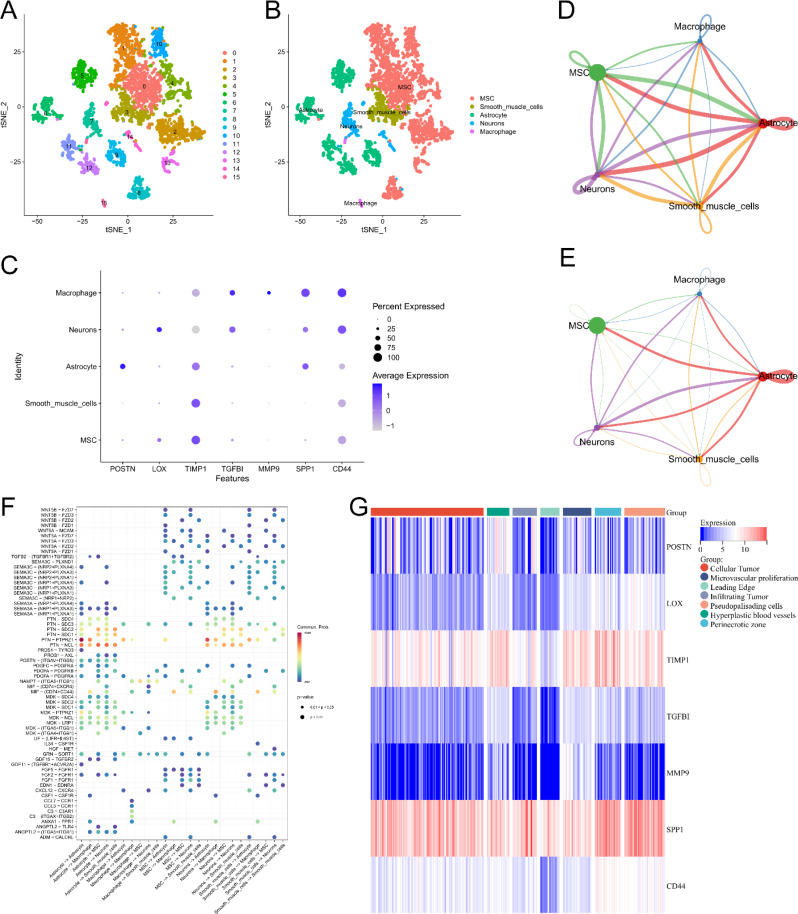
Fig. 10.
Results of data analysis for single-cell sequencing. (A-B) Cluster and cell type annotation of tumor microenvironment cells. (C) Expression characteristics of risk model related genes in different cells. (D) Circle interaction plots showing the number of cell-to-cell communication. The size of the circle represents the number of cells. The thickness of the lines between the cells represents the number of times the two cells communicate. The color of the lines represents the type of cell that serves as a ligand. (E) Circle interaction plots showing the strength of cell-to-cell communication. The size of the circle represents the number of cells. The thickness of the lines between the cells represents the strength of communication between the two cells. The color of the lines represents the type of cell that serves as a ligand. (F) The ligand-receptor interactions between cells. X-axis shows the type of cells that interact. The cells in the front are the cells where the ligand is located and the cells in the back are the cells where the receptor is located. Y-axis shows the names of the ligand-receptors. The colors of the circles in the picture represent the average expression levels of these two genes in cells. A redder color indicates a higher level of expression. The size of the circle represents the size of the p-value. (G) Heat map of risk model related genes in anatomical locations of tumor samples according to Ivy Glioblastoma Atlas. Leading Edge is the tumor cells at the boundary of the tumor as determined by histological methods. Recurrence of gliomas often begins at this site. Infiltrating Tumor is the portion of tumor tissue that invades normal tissue. Cellular Tumor is the core portion of tumor tissue as determined by histological method

