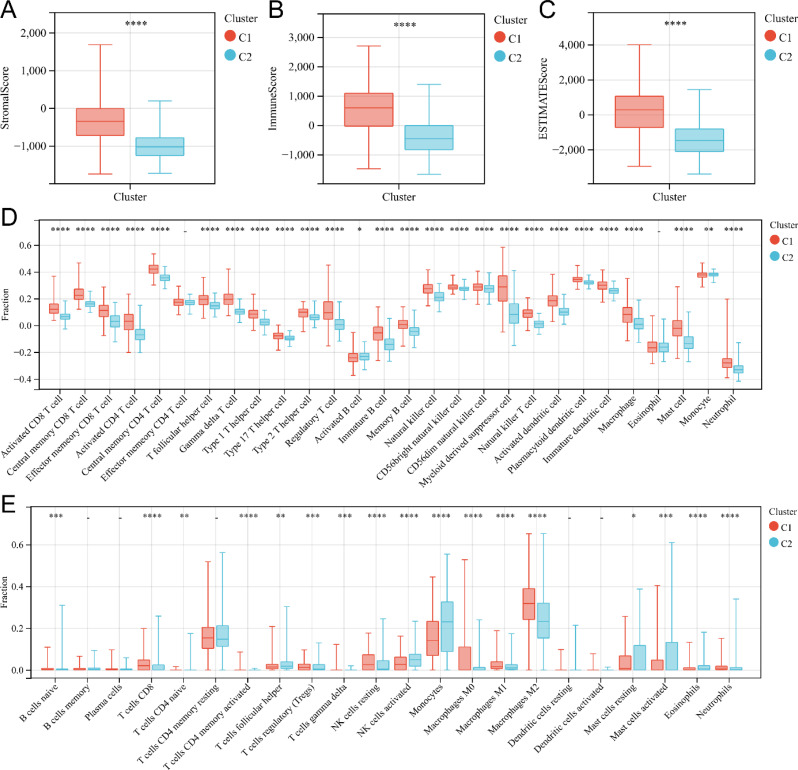
Fig. 3.
Immunocyte infiltration analysis of two subgroups related to nicotinamide metabolism. (A-C) Box plot of interstitial score(A), immune score (B), and ESTIMATE score (C) for patients with high and low nicotinamide metabolism subgroups. (D) Box plot of immune cell infiltration levels in high nicotinamide metabolism and low nicotinamide metabolism subgroups analyzed by ssGSEA. (E) Box plot of immune cell infiltration levels in high nicotinamide metabolism and low nicotinamide metabolism subgroups calculated by CIBERSORT. *P < 0.05; **P < 0.01; ***P < 0.001, ****P < 0.0001; -, not significant

