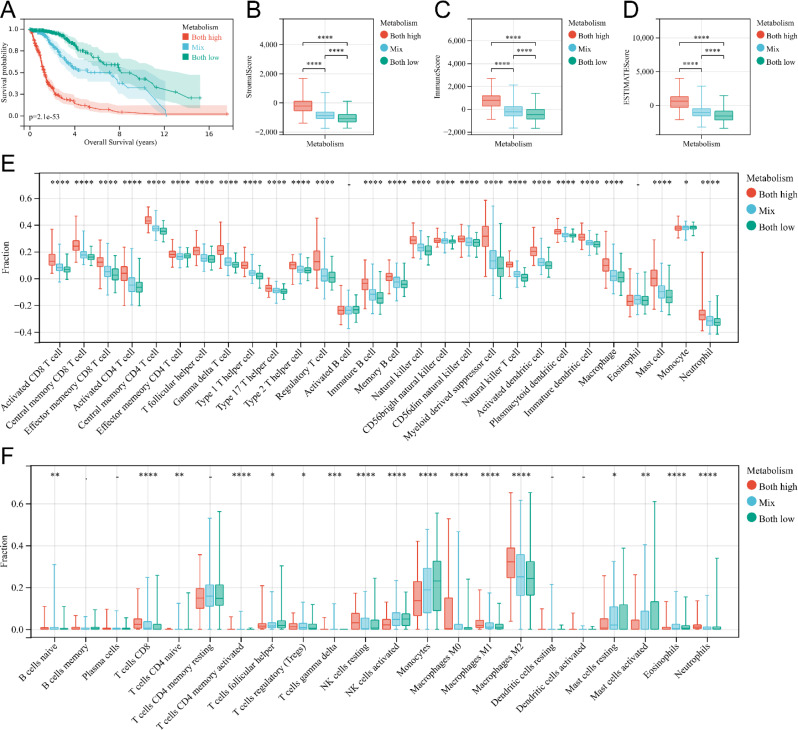
Fig. 5.
Immunocyte infiltration analysis of nicotinamide-tryptophan metabolism related subgroups. (A) Kaplan Meier survival curves of glioma patients of high nicotinamide-tryptophan metabolism group, mixed group, and low nicotinamide-tryptophan metabolism group. (B-D) Box plot of stromal score (B), immune score (C), and ESTIMATE score (D) for the three groups of patients mentioned above. (E) Box plot of immune cell infiltration levels in high nicotinamide-tryptophan metabolism group, mixed group, and low nicotinamide-tryptophan metabolism group analyzed by ssGSEA. (F) Box plot of immune cell infiltration levels in high nicotinamide-tryptophan metabolism group, mixed group, and low nicotinamide-tryptophan metabolism group analyzed by CIBERSORT

