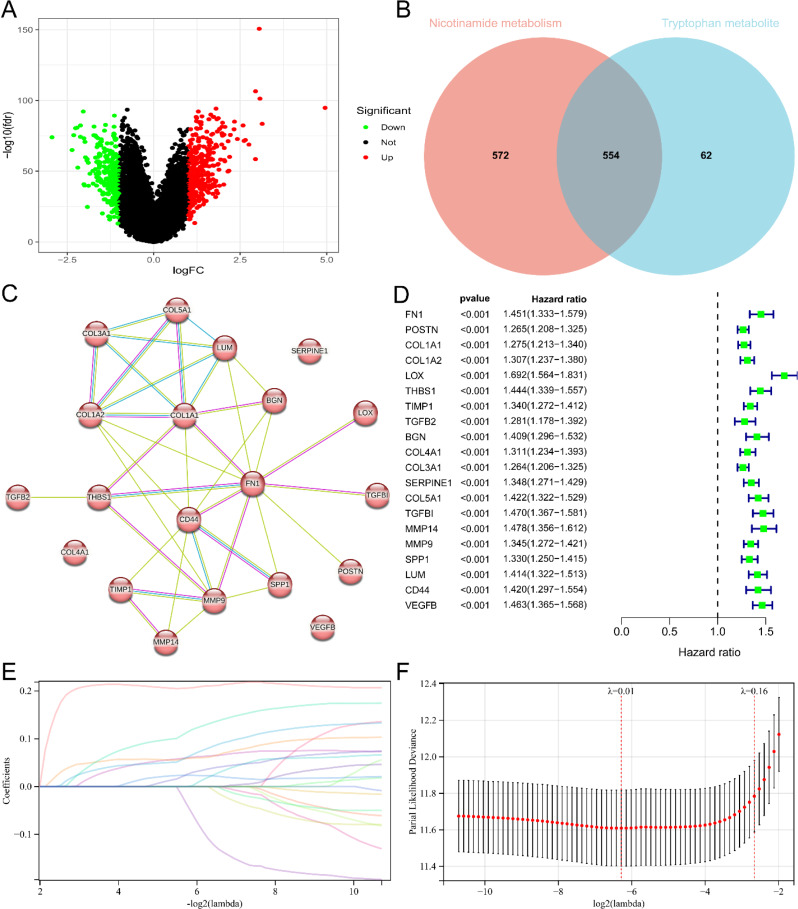
Fig. 6.
Identification of core genes related to nicotinamide and tryptophan metabolism and establishment of prognostic risk score signatures. (A) Volcano map of differentially expressed genes in two subgroups related to tryptophan metabolism. Red and green represent differentially expressed genes with upregulation and downregulation of gene expression. (B) Venn plot showing the overlap relationship between differentially expressed genes in two subgroups of nicotinamide metabolism and differentially expressed genes in two subgroups of tryptophan metabolism. Numbers represent the number of genes. (C) PPI network formed by 20 core genes. The network nodes are proteins. The edges represent the predicted functional associations. Purple line - experimental evidence. Yellow line - textmining evidence. Light blue line - database evidence. (D) Single factor Cox regression analysis of 20 core genes related to nicotinamide and tryptophan metabolism. (E) Lasso coefficient spectra of 20 core genes. The positive coefficient means that the algorithm believes that high expression of the gene predicts a poorer prognosis for glioma. The negative coefficient means that the algorithm believes that high expression of the gene predicts a better prognosis for gliomas. (F) Cross validation fitting curve calculated by lasso regression method. The range between the two dashed lines shows the range of optimal λ values considered by the algorithm

