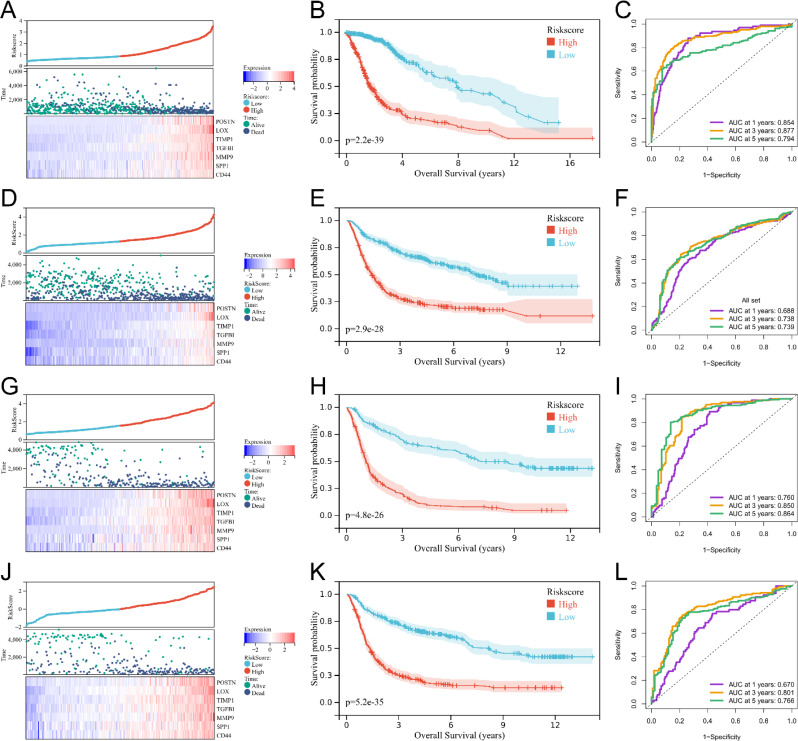
Fig. 7.
Verification of the signature of the prognostic risk score for nicotinamide-tryptophan metabolism. (A) Heat map of glioma patients in TCGA based on the distribution of the risk score. (B) Kaplan Meier survival curves for glioma patients in TCGA based on the risk score. (C) ROC curves for predicting 1-, 3-, and 5-year survival of glioma patients by the risk score in TCGA. (D) Heatmap of glioma patients in CGGA mRNAseq693 based on the distribution of the risk score. (E) Kaplan Meier survival curves for glioma patients in CGGA mRNAseq693 based on the risk score. (F) ROC curves for predicting 1-, 3-, and 5-year survival of glioma patients by the risk score in CGGA mRNAseq693. (G) Heatmap of glioma patients in CGGA mRNAseq325 based on the distribution of the risk score. (H) Kaplan Meier survival curves for glioma patients in CGGA mRNAseq325 based on the risk score. (I) ROC curves for predicting 1-, 3-, and 5-year survival of glioma patients by the risk score in CGGA mRNAseq325. (J) Heatmap of glioma patients in CGGA mRNAarray based on the distribution of the risk score. (K) Kaplan Meier survival curves for glioma patients in CGGA mRNAarray based on the risk score. (L) ROC curves for predicting 1-, 3-, and 5-year survival of glioma patients by the risk score in CGGA mRNAarray

