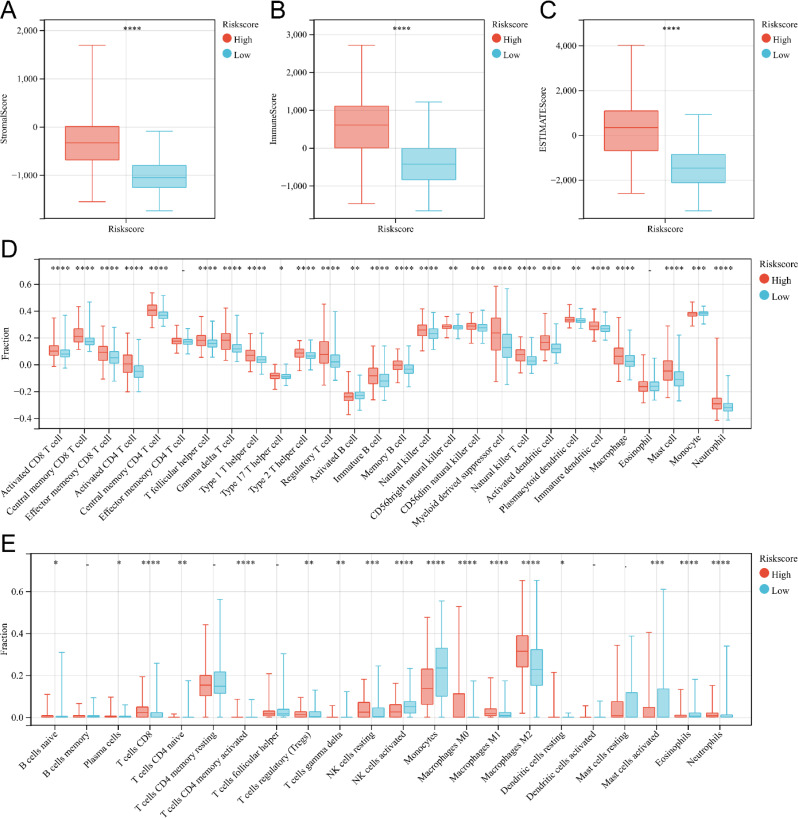
Fig. 8.
Analysis of immune cell infiltration in two subgroups related to the risk score of TCGA. (A-C) Box plot of stromal score (A), immune score (B), and ESTIMATE score (C) for patients in the high and low-risk score groups. (D)Box plot of immune cell infiltration levels high-risk score and low-risk score groups analyzed by ssGSEA. (E)Box plot of immune cell infiltration levels in high-risk score and low-risk score groups analyzed by CIBERSORT. *P < 0.05; **P < 0.01; ***P < 0.001, ****P < 0.0001; -, not significant

