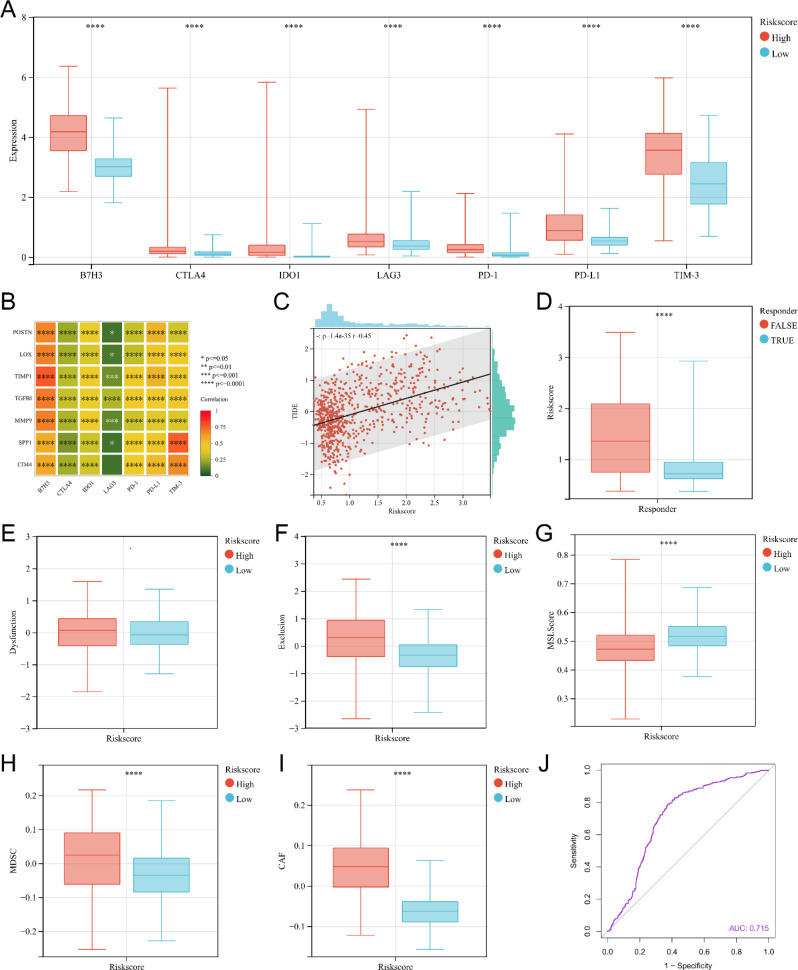
Fig. 9.
The predictive role of risk model of TCGA for ICI treatment response. (A) The box plot of immune checkpoint expression in the high-risk score group and low-risk score group. (B) Correlation analysis between the expression levels of risk model-related genes and the expression levels of immune checkpoints. (C) Correlation analysis between the risk score and TIDE score. (D) The box plot of risk score for predicting ICI treatment true responder and false responder gliomas using the TIDE algorithm. (E) The box plot of Dysfunction score for high-risk score group and low-risk score group. (F) The box plot of Dysfunction score for high-risk score group and low-risk score group. (G) The box plot of MSI score for high-risk score group and low-risk score group. (H) The box plot of MDSC for high-risk score group and low-risk score group. (I) The box plots of CAF for high-risk score group and low-risk score group. (J) The ROC curve of the risk score predicting response to ICI treatment

