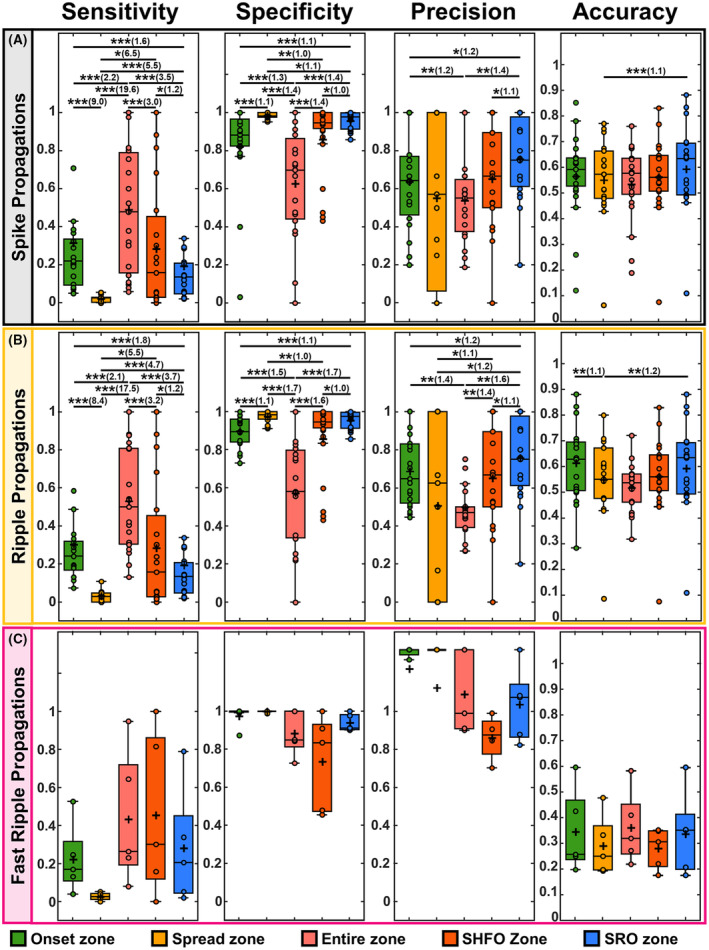
Figure 3.

Statistics for prediction of resection in good outcome patients. (A) Sensitivity, specificity, precision, and accuracy of the onset and spread zone of spike propagations, the entire zone of spikes, the spikes co‐occurring with HFOs (SHFO) zone, and spike–ripple onset overlap zone (SRO) in predicting the resection zone of good outcome patients with SRO (21 patients). (B) Statistics for ripple onset and spread zones, the entire ripple zone, the SHFO, and the SRO in predicting resection zone of good outcome patients with SRO (21 patients). (C) Statistics for fast ripple onset and spread zones, the entire fast ripple zone, the SHFO, and the SRO in predicting resection zone of good outcome patients (5 patients). In the boxplots, the cross indicates the mean value, and the horizontal lines indicate the median value, lower and upper edges represent the 25th and 75th percentiles, whiskers extend to the 0th and 100th percentiles (excluding outliers) and points outside the whiskers represent the outliers (i.e., values that are at least 1.5 times the interquartile range below the 25th percentile or above the 75th percentile). The multiple comparisons issue was accounted for using the false discovery rate (FDR) correction. Pairs of significant differences are indicated by horizontal lines with asterisks above them: **p < 0.01, and ***p < 0.001. The effect size in significant comparisons is calculated as the ratio of the higher median value to the lower median value and is reported in parentheses after the asterisks.
