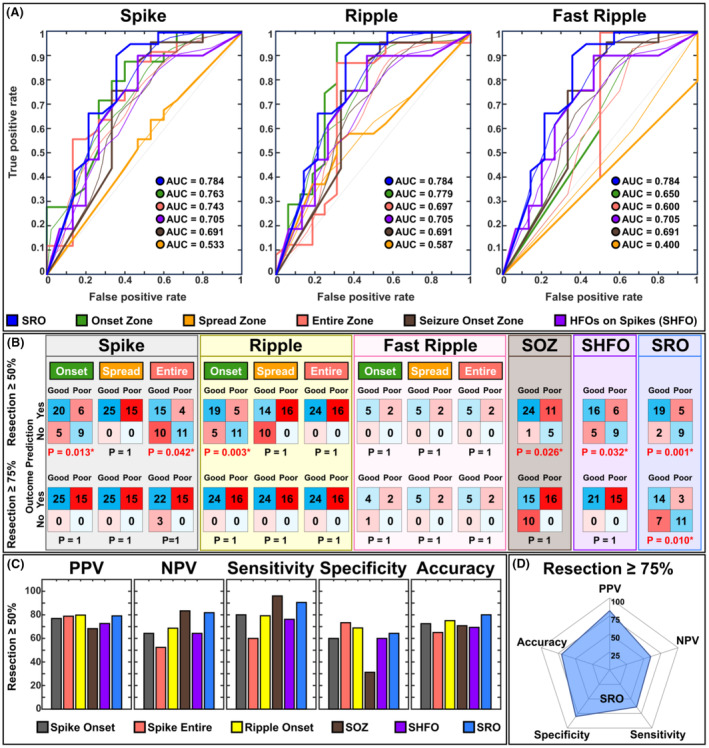
Figure 5.

Outcome prediction results. (A) From left to right: receiver operating characteristic (ROC) curve and their area under the curve (AUC) for onset, spread, and entire zones of spike (40 patients), ripple (40 patients), and fast ripple propagations (7 patients), spike co‐occurring with HFOs (SHFO) zone (36 patients), the spike–ripple onset overlap zone (SRO, 35 patients), and the seizure onset zone (SOZ, 41 patients) as predictors of postsurgical outcome. (B) Confusion matrices for each of the zones in predicting the surgical outcome at resection threshold of 50% and resection threshold of 75% using the logistic regression with leave one out cross validation method. (C) from left to right: positive predictive value (PPV), negative predictive value (NPV), sensitivity, specificity, and accuracy of each of the zones for predicting the outcome corresponding to the resection threshold of 50%. (D) Spider plot of PPV, NPV, sensitivity, specificity, and accuracy of each of the zones for predicting the outcome corresponding to the resection threshold of 75%.
