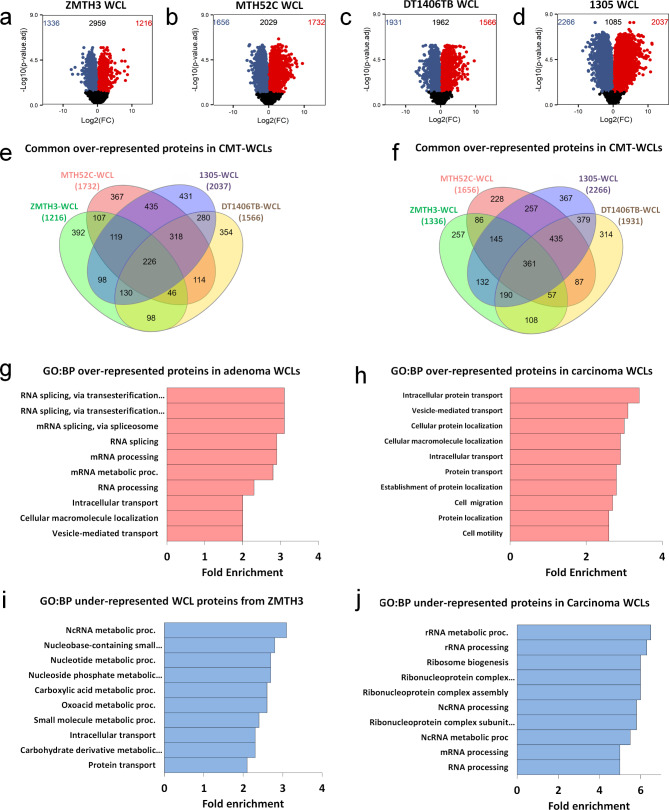
Fig. 2.
Differential analysis in WCL protein abundance levels of CMTs when compared to healthy control MTH53A. Volcano plots of (a) adenoma ZMTH3, (b) Volcano plot of simple carcinoma MTH52C, (c) complex carcinoma DT1406TB, and (d) complex carcinoma 1305, when compared to the healthy control. Red dots in the top right area were over-represented in the CMT cell line relative to MTH53A. Blue dots in the top left area were under-represented in CMT cell line relative to MTH53A. Black dots below the dashed line represent proteins with no statistical difference (p > 0.05). (e) Venn diagram showing the overlap between the WCL proteins over-represented (p < 0.05) in all the CMT cell lines. (f) Gene ontology of over-represented ZMTH3 WCL proteins enriched in biological process pathways (GO: BP) expressed as fold enrichment scores (F.E.), considering a false discovery rate (FDR) < 0.05. (g) Gene ontology of common over-represented WCL proteins of carcinoma cell lines enriched in biological process pathways (GO: BP). (h) Venn diagram showing the overlap between the WCL proteins under-represented (p < 0.05) in all the CMT cell lines. (i) Gene ontology of under-represented ZMTH3 WCL proteins enriched in biological process pathways (GO: BP). (j) Gene ontology of common under-represented WCL proteins of carcinoma cell lines enriched in biological process pathways (GO: BP)

