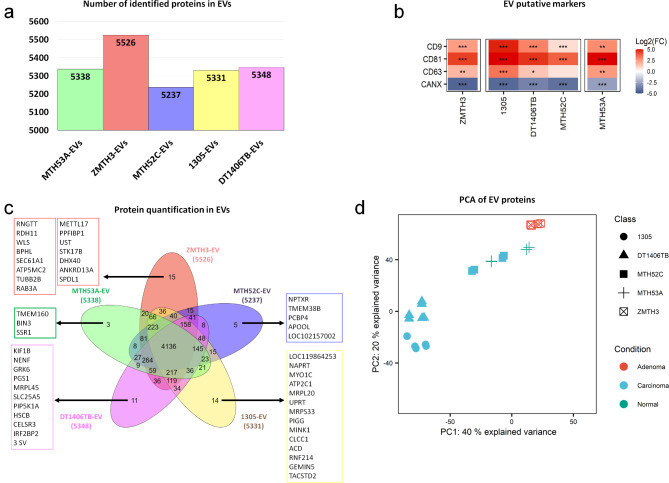
Fig. 3.
Mass spectrometry-based profiling of EV proteomes. (a) Protein groups identified in each EV-derived cell line. (b) Heatmap illustrating EV protein markers CD9, CD63, CD81 and calnexin (CANX) in EV-derived protein compared with the WCLs based on their log2-transformed fold-changes. (c) Overlap of protein intensities quantified in each EV-derived cell line. (d) Principal component analysis of EV proteins of healthy control and CMT cell lines

