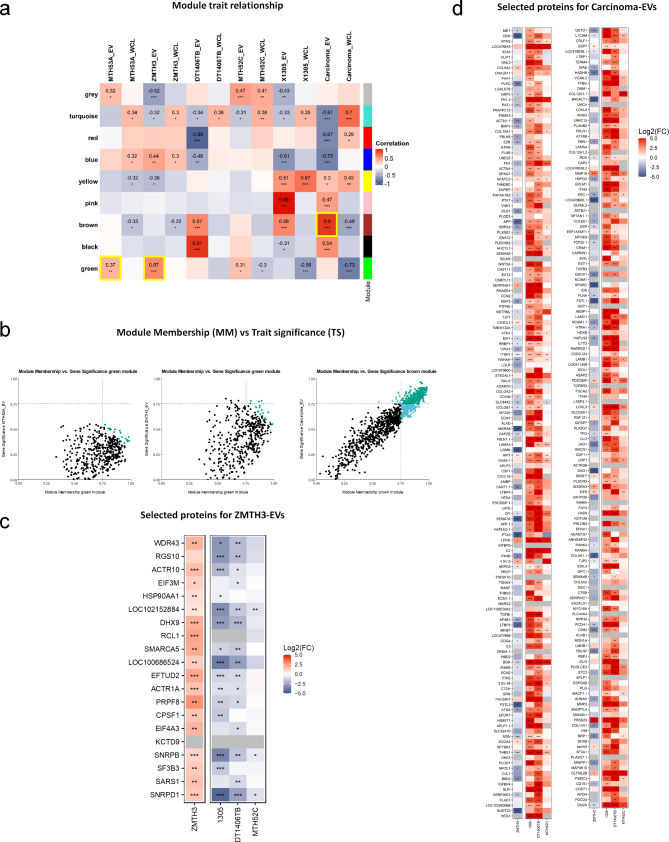
Fig. 5.
Selection of protein “key drivers” for further EV proteomic signatures. a) Heatmap of the EV proteomic profiles selected for each cell line (protein “key drivers”). (a) Module trait relationship. Pearson correlation of co-abundant proteins for each trait (Sample types: WCL and EVs; groups: carcinoma, simple carcinoma, and complex carcinoma) in every module colour. The significance of the correlation is indicated with asterisks (* p ≤ 0.05, ** p ≤ 0.01, *** p ≤ 0.001). Yellow squares highlight the modules of interest for further key driver identification in each subtype (EVs). (b) Module membership (MM) vs trait significance (TS) with a correlation cut-off ≥ 0.75. From left to right: selected module for healthy control MTH53A; selected module (green) for adenoma ZMTH3; selected module (brown) for Carcinoma. Real “key drivers” are shown in green colour. (c) Adenoma ZMTH3 top 20 selected protein key driver. (d) All three carcinoma cell lines-derived protein key drivers. Significance of log2FCs is indicated with asterisks (* p ≤ 0.05, ** p ≤ 0.01, *** p ≤ 0.001)

