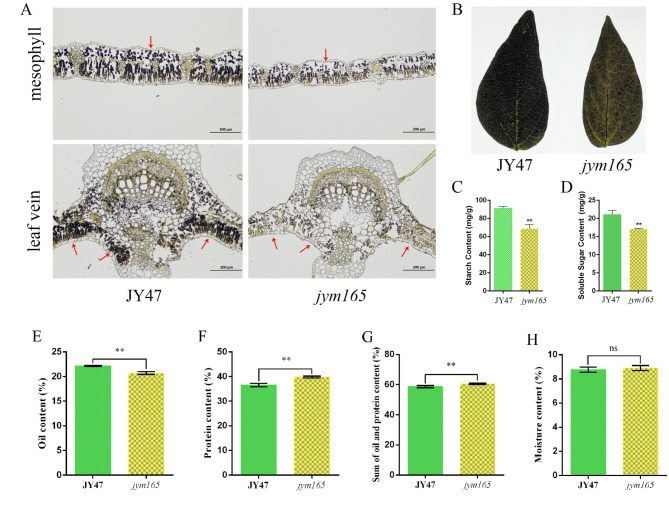
Fig. 4.
Leaves starch content and quality traits of seed analyses. A. Iodine-potassium iodide stain of mesophyll and leaf vein cell. The red arrows pointing out starch granules. B. Iodine-potassium iodide stain of the entire leaf. C. Starch content determination. D. Soluble sugar content determination. E-H. Quality traits of JY47 and jym165, E. Oil content; F. protein content; G. Sum of oil and protein content; H. Moisture content. The analyses of starch and soluble sugar content were three ten biological replicates, and the quality traits of seed analyses were ten biological replicates. These values represent means ± SDs. Asterisks indicate significant differences according to the Student’s t-test (*P < 0.05, **P < 0.01)

