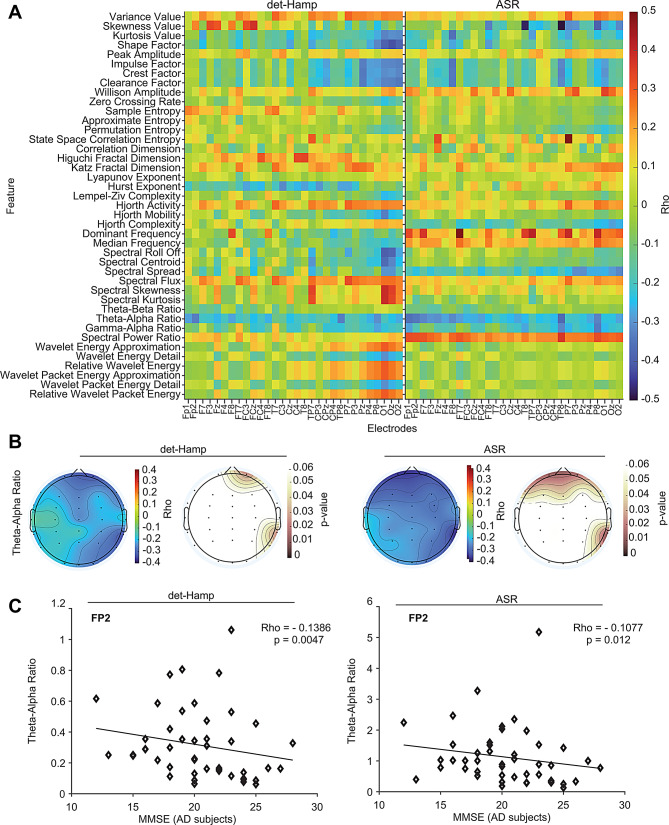
Fig. 3.
Correlation of EEG features with MMSE scores in AD subjects. (A) Heatmaps show Spearman’s rank correlation between EEG features and MMSE of AD subjects using det-Hamp (left) and ASR (right) pipelines. (B) Topographical plots show the correlation between theta/alpha power ratio and MMSE across all electrodes using det-Hamp (left) and ASR (middle right) pipelines. Correlations with significant P values using det-Hamp (left middle) and ASR (right) are shown. (C) The correlation between theta/alpha power ratio and MMSE of AD subjects for representative FP2 electrode (rho = -0.1386, P = 0.0047) or ASR (rho = -0.1077, P = 0.012) pipelines are shown

