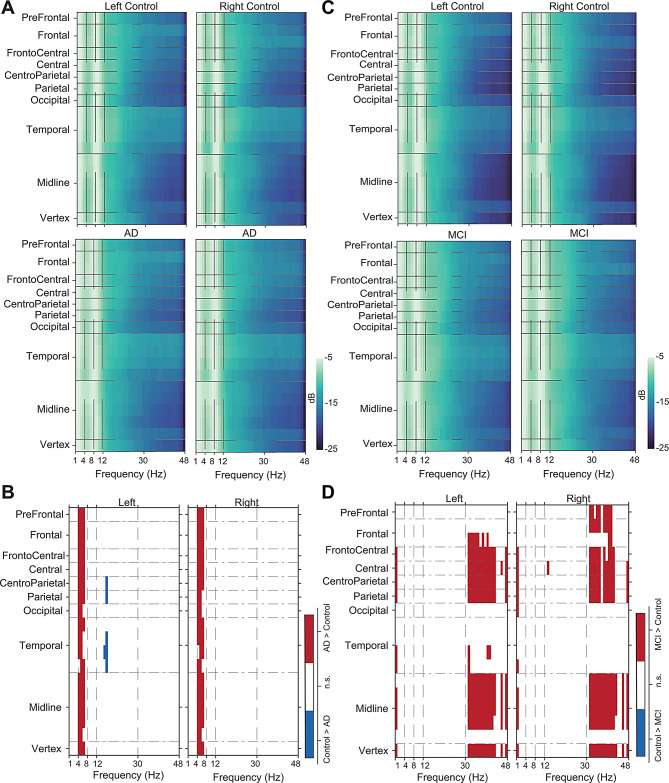
Fig. 5.
Changes in theta power in AD and gamma power in prodromal AD. (A) Heatmaps show the average EEG power in different areas across left and right brain hemispheres in controls (N = 46) and AD subjects (N = 46). (B) PSD differences between controls and AD after FDR correction. (C) Heatmaps show the average EEG power in different areas across left and right brain hemispheres between controls (N = 30) and prodromal AD subjects (N = 30). (D) PSD differences between control and prodromal AD after FDR correction are shown

