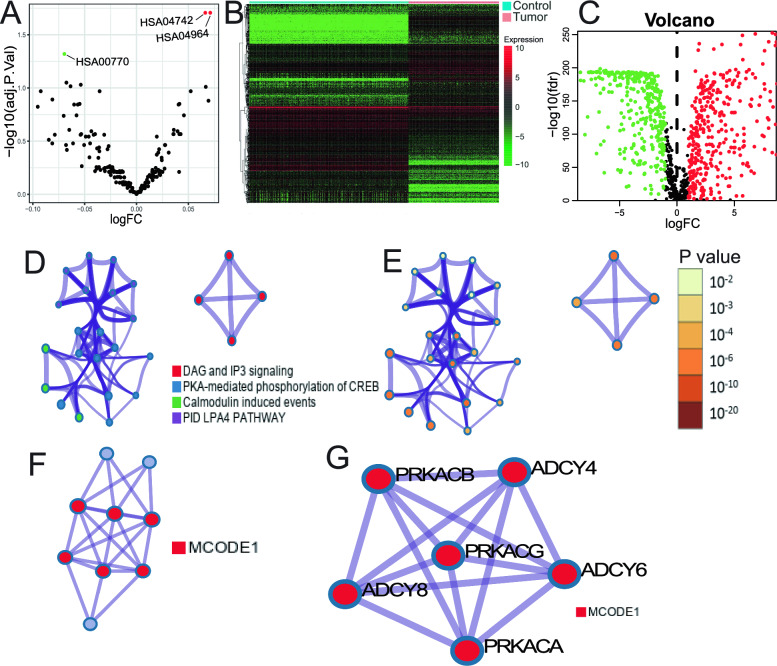
Fig. 2.
Comprehensive Analysis of TMB Groups, Differential Expression, Functional Pathways, and Network Interactions. A Gene Set Variation Analysis (GSVA) results comparing high and low TMB groups, highlighting pathway activity differences. B, C Volcano plots illustrating differential expression of lncRNAs between normal skin tissues and Skin Cutaneous Melanoma (SKCM), with log fold change (logFC) and adjusted p-values represented. D, E Network diagrams showing relationships among four functional pathways identified through pathway and process enrichment analysis, with nodes color-coded based on pathways. and statistical significance. F, G Protein–Protein Interaction (PPI) network visualized with MCODE components identified within the TIgeneSet, highlighting significant molecular interactions and gene clusters

