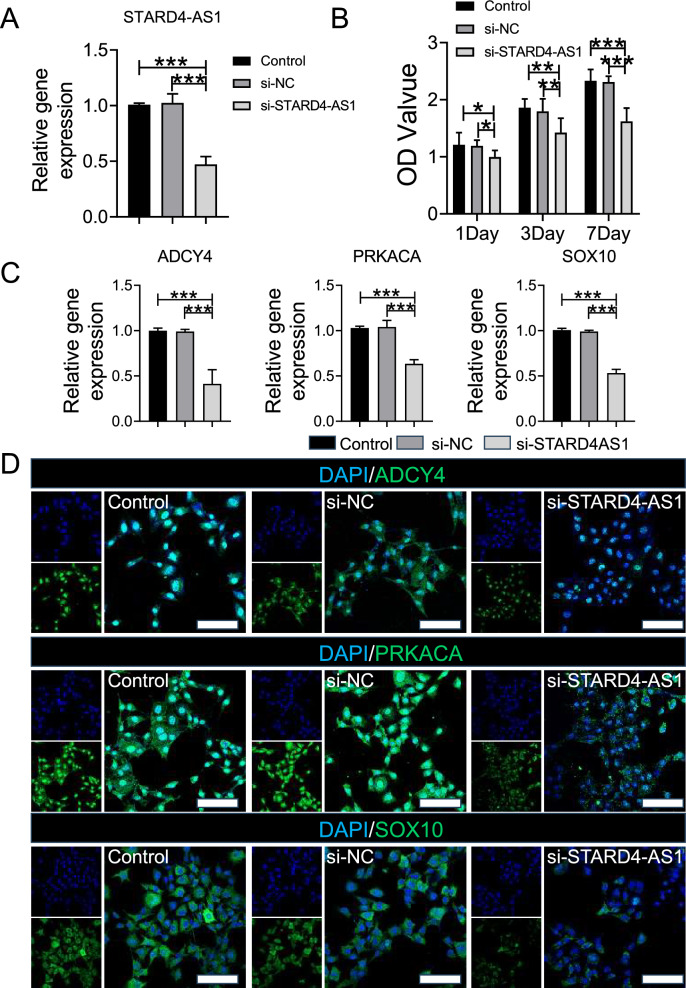
Fig. 5.
Analysis of Gene Expression and Tumor Cell Proliferation. A The expression of STARD4-AS1 gene was detected by PCR. B CCK8 was used to detect the proliferation of tumor cells in each group. C The expression of ADCY4, PRKACA and SOX10 genes were detected by PCR. D The expression of ADCY4, PRKACA and SOX10 in tumor cells were detected by immunofluorescence (Scale bar represents 50 μm). Statistical differences were determined by utilizing One-way ANOVA with Bonferroni's multiple comparison tests when comparing three groups. When comparing two groups, the unpaired t-test was utilized. Data are expressed as mean ± SD (*P < 0.05, **P < 0.01, and ***P < 0.001)

