Fig. 1.
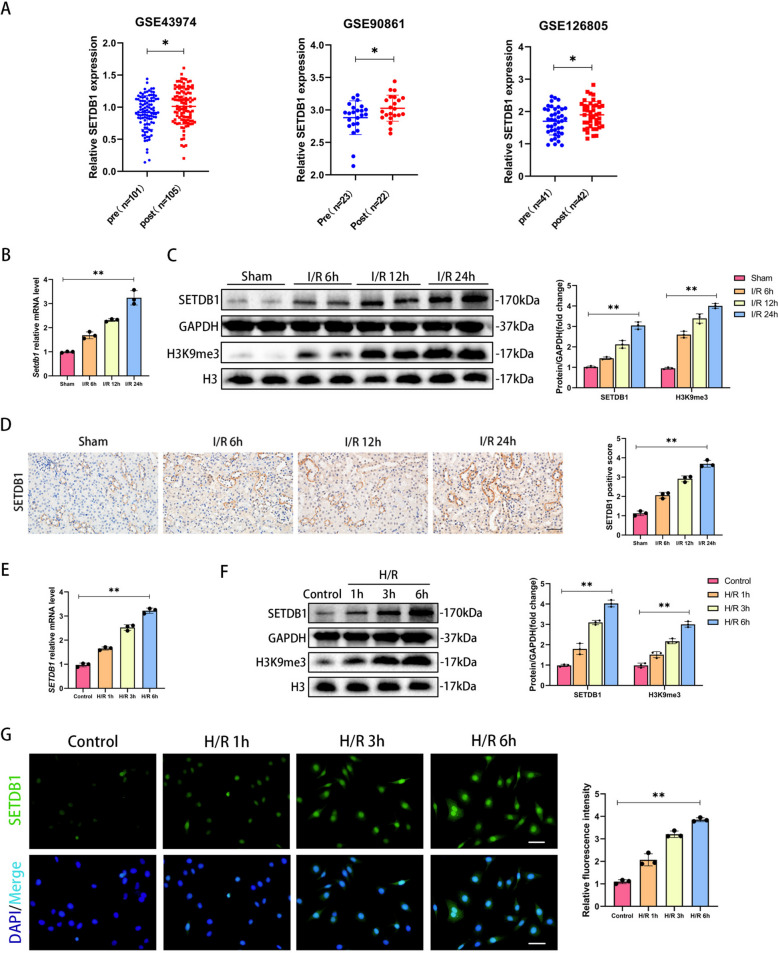
SETDB1 was upregulated in I/R model of mice and H/R model of HK-2 cells. A Analysis of SETDB1 expression in human kidney tissue pre-ischemia (pre) and post-reperfusion (post) using GEO dataset (GSE43974, GSE90861, GSE126805). B qPCR detection of SETDB1 mRNA levels in mice kidney tissues. C WB detection of SETDB1 and H3K9me3 protein levels in mice kidney tissues. D Representative images of immunohistochemistry of SETDB1 in mice kidney tissues (left) and related quantitative analysis (right). Bar = 50 μm. E qPCR detection of SETDB1 mRNA levels in HK-2 cells. F WB detection of SETDB1 protein levels in HK-2 cells. G Representative images of immunofluorescence (green) of SETDB1 in HK-2 cells (left) and related quantitative analysis (right). Bar = 50 μm. Values are expressed as the mean ± SEM. N = 3. The * represents differences between groups, and p < 0.05. The ** represents differences between groups, and p < 0.01

