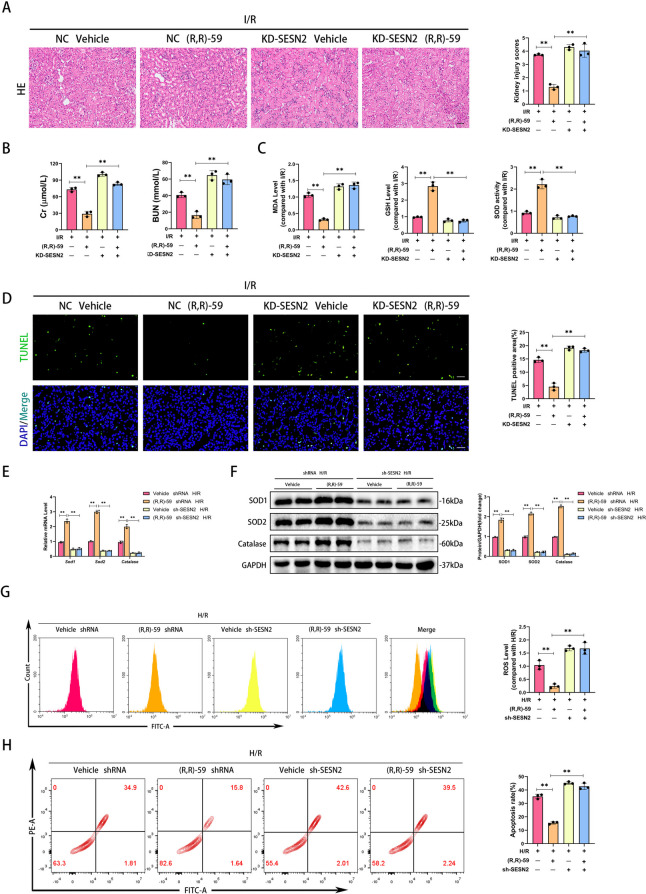
Fig. 7.
Knockdown of SESN2 hindered the treatment of oxidative stress mediated by (R,R)-59 in vivo and in vitro. A Representative images of HE staining in mice kidney tissues (left) and related quantitative analysis (right). Bar = 50 μm. B Detection of Cr and BUN in mice serum. C Detection of the level of MDA, GSH, and the activity of SOD in mice kidney tissues. D Representative images of TUNEL staining in mice kidney tissues (left) and related quantitative analysis (right). Bar = 100 μm. E qPCR detection of SOD1, SOD2, and Catalase mRNA levels. F WB detection of SOD1, SOD2, and Catalase protein levels. G Detection of ROS levels in HK-2 cells by flow cytometry. H Detection of apoptosis rate in HK-2 cells by flow cytometry. Values are expressed as the mean ± SEM. N = 3. The ** represents differences between groups, and p < 0.01

