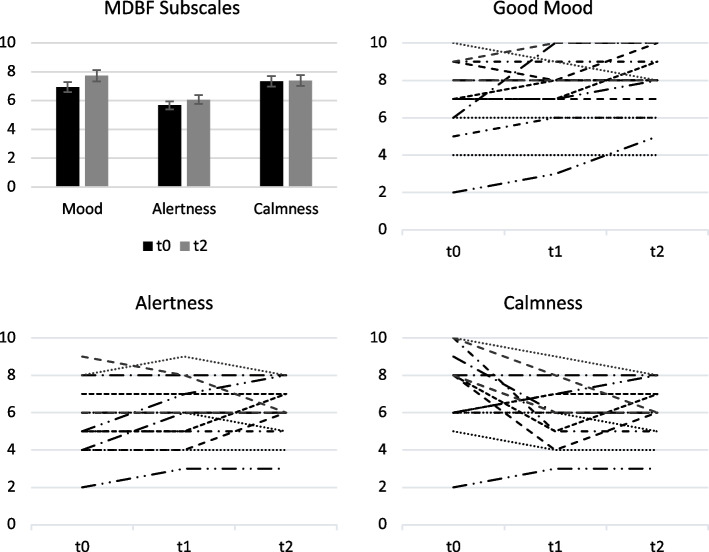
Fig. 3.
Well-being as reflected by the MDBF subscales. Mean values ± SE (bar chart) and individual changes (spaghetti diagrams) across all measurement time points. Lines of the spaghetti diagram represent the scores of the individual patients. SE = standard error, t0 = baseline, t1 = after the first VR, t2 = after the intervention. Higher scores are associated with the positive pole of the scales bad-good mood, tiredness-alertness, restlessness-calmness. In n = 8/5/3 of the patients (pts) the scores improved, in n = 6/5/2 pts stayed the same, and in n = 1/5/10 pts the scores moved in the direction of the opposite pole of the mood/alertness/calmness subscale after the VR

