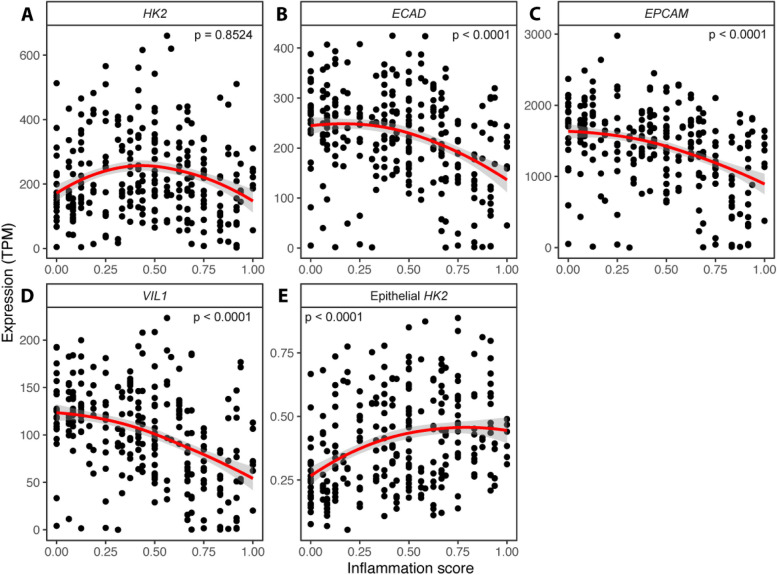
Fig. 1.
Epithelial HK2 expression correlates with inflammation severity. A–D Expression (TPM, transcript per million) of HK2 (A) and the epithelial marker genes ECAD (B), EPCAM (C), and VIL1 (D) in the sigmoid colon mucosa of patients with various degrees of gut inflammation. Note that at high inflammation scores (> 0.4) expression of HK2 and the epithelial marker genes all decrease indicating epithelial erosion. The inflammation score was calculated as a scaled Harvey-Bradshaw index (Crohn’s disease) or Mayo score (ulcerative colitis) to accommodate both disease types. E HK2 expression increases with inflammation scores after normalization to epithelial marker gene expression. The red lines represent the mean expression trendline with the grey area indicating its 95% confidence interval. The number in the upper left/right corner represents the p value for the correlation between gene expression and inflammation score as determined by linear mixed model

