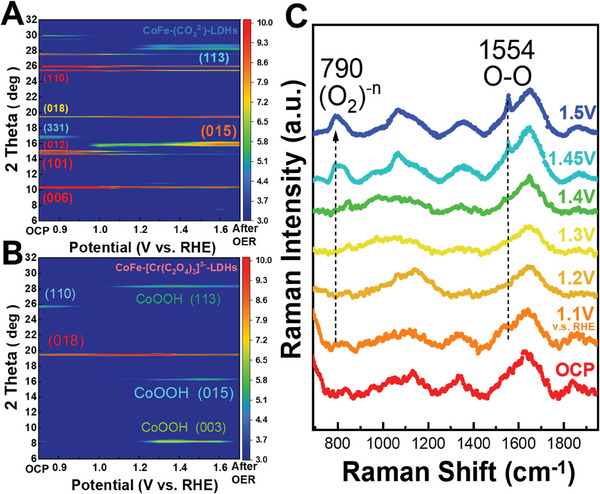
Figure 4.

Contour plots of operando X‐ray diffraction signals of A) CoFe‐(CO3 2−)‐LDHs and B) CoFe‐[Cr(C2O4)3]3−‐LDHs in aqueous solution of 1 M KOH (pH = 14). Images show diffraction intensity (color‐coded) as a function of voltage, and data were collected at 12 keV. C) In situ/operando Raman characterization of high‐valence Co site during OER.
