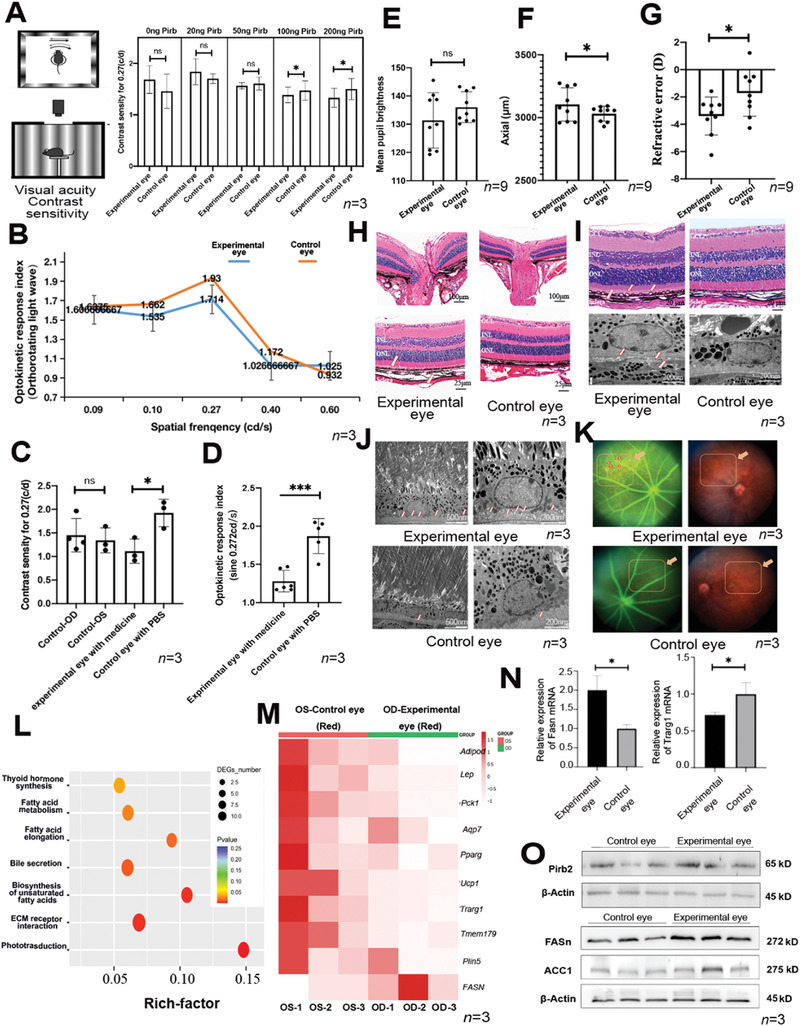
Figure 5.

Increasing Pirb protein in mouse eyes induces significant changes in myopia phenotype. A) Injecting different concentrations of drugs into mice caused changes in their visual sensitivity (n = 3). B) Injecting a drug concentration of 200 ng into mice caused significant differences in their optokinetic response index (Orthorotating light wave) (n = 3). C) Injecting a drug concentration of 200 ng into mice caused a decrease in contrast density (n = 3). D) Injecting a drug concentration of 200 ng into mice caused a decrease in the optokinetic response index (n = 3). E) The pupil lightness results of the mice injected with 200 ng Pirb protein (n = 9). F) The axial length increased in the mice injected with 200 ng Pirb protein (n = 9). G) The reference error decreased in the mice injected with 200 ng Pirb protein (n = 9). H) Paraffin sectioning was performed on experimental mice, and HE staining was performed. Pathological changes were found near the retinal ganglia of the mice injected with 200 ng of the drug (n = 3). Scale bars, 100 and 25 µm. I) Significant suprachoroidal vacuoles were found near the choroid of the mouse fundus in the experimental group (n = 3). Scale bars, 20 µm, and 200 nm. J) After electron microscopic observation, it was found that small vacuoles also existed in the choroid, the area where lipids were abundant in the experimental group (n = 3). Scale bars, 500 and 200 µm. K) Fundus photography results of the mice injected with 200 ng of the drug. After taking fundus photos, we found that the experimental group exhibited a certain myopic arc‐shaped fundus phenotype (n = 3). L) Using RNA sequencing to analyze the difference between the experimental group and the control group, we found that the fatty acid metabolism pathway was significantly enriched. M) Differential analysis of the genes related to the fatty acid metabolism pathway in RNA sequencing (n = 3). N,O) The qPCR and WB results of fatty‐related gene expression (n = 3). The P values were two‐sided and adjustments were made for multiple comparisons. n indicates the number of biologically independent samples examined. The unpaired Student's t‐test and one‐way ANOVA were conducted to assess statistical significance, * p < 0.05, ** p < 0.01, *** p < 0.001.
