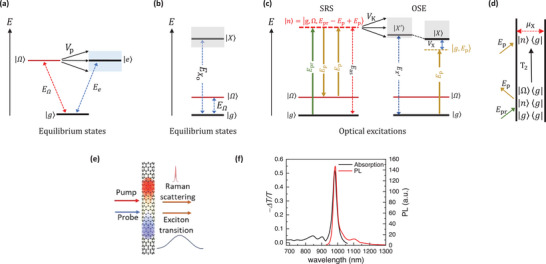
Figure 1.

Schematics of Fano quantum interference. a) Classical model of Fano interference between coupled discrete phonon |Ω〉 and continuum state |e〉 with closely matched excitation energies. The blue‐shaded area shows the bandwidth of the continuum. b) Excitation energy of bare exciton |X〉 and discrete phonon |Ω〉 states in low‐dimensional semiconductors. The grey‐shaded area shows the bandwidth of the exciton continuum. c) Schematic diagram describing the optically‐driven quantum interference arising from the phonon Raman intermediate state |n〉 coupled to the excitonic Floquet band |X′〉 through electron‐phonon coupling V K (black double arrow). Under optical excitation, the Floquet states |g, E p〉 hybridize with |X〉 through optical Stark effects (OSE) governed by electron‐photon coupling V X (indicated by blue double arrow), leading to energy blueshift of the excitonic Floquet states |X′〉 (right panel). The interplays between electrons, phonons, and photons lead to rich stimulated Raman scattering (SRS) phenomena (left panel), a four‐wave mixing process. Following the generation of vibrational coherence by E p and E pr, interactions with another E p give rise to third‐order phonon Raman intermediate state |n〉, an admixture of electronic and phonon state |g, Ω, E pr − E p + E p〉, with energy depends on E pr and E p in the 3 field‐matter interactions. By employing a broadband probe with energy spans across exciton resonance, and controlling the pump energy, the outgoing Raman scattered photon, E as, can be tuned to align with the exciton resonance. d) The double‐sided Feynman diagram showing the evolution of the density matrix during the SRS described in (c). Arrows pointing into (away from) the diagram denote the absorption (emission) of photons. The horizontal dashed red arrow shows the overlap of bra and ket states mediated by the transition dipole moment μX to give the third‐order polarization. T 2 describes the dephasing rate of vibrational coherence |Ω〉〈g| e) Illustration of the ultrafast pump‐probe spectroscopy on SWCNTs. f) The absorption (− ΔT/T, black solid line) and emission (PL, red solid line) spectra of semiconducting SWCNTs.
