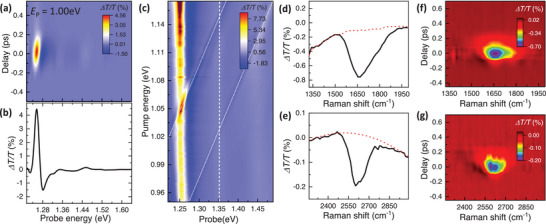
Figure 2.

Energy‐dependent pump‐probe spectroscopy. a) Pump‐probe spectra of SWCNTs at room temperature. The color scale, vertical axis, and horizontal axis represent the transmission change ΔT/T, the pump‐probe time delay τ, and probe photon energy, respectively. The positive (negative) ΔT/T represents a decrease (increase) in absorption. The sample was excited with a linearly polarized pump at a photon energy E p of 1.00 eV. b) At τ = 0 ps, the pump‐induced signals show spectral responses that are dominated by energy blueshift near the exciton resonance, signifying a blueshift of excitonic Floquet state |X′〉 under negatively detuned driving pump excitations. c) 2D plot of pump‐probe spectra at τ = 0 ps under different pump energies. The pump intensity was kept constant at 0.7 GW cm−2. The color scale, horizontal axis, and vertical axis represent transmission change ΔT/T, pump, and probe photon energy, respectively. Close to the exciton resonance, the optical responses are dominated by the optical Stark shift of exciton transition. Additionally, 2 prominent pump‐probe signals emerge diagonally across the 2D plot (indicated with white dotted lines), where the peak energy of the signals shifts by the same amount as E p, a defining signature of stimulated Raman scattering. d, e). Transient pump‐probe signals extracted along a line cut shown in (c) at a probe energy of 1.351 eV (vertical white dashed line). The horizontal axis corresponds to the Raman shift deduced from the energy difference between the probe and pump. The sharp features at energies close to 1650 cm−1 (d) and 2610 cm−1 (e) correspond to G‐mode and 2D‐mode phonon resonances in SWCNTs, respectively. f, g) Stimulated Raman scattering signals for G‐mode (f) and 2D‐mode (g) phonons at different τ (broad electronic transition backgrounds are subtracted) detected along E pr = 1.351 eV probe channel.
