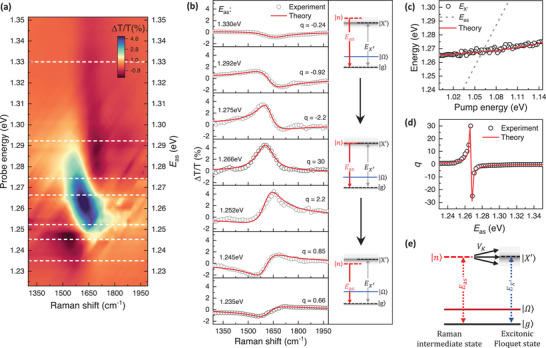
Figure 3.

Raman spectra of the optically tunable many‐body Fano resonance. a) 2D plot of transient Raman spectra at various probe energies at τ = 0 ps. For SRS detected along the probe direction, the probe energy simply coincides with the Raman scattering resonance E as (right vertical axis). The horizontal axis shows the Raman shift calculated from the energy difference between the pump and probe for each probe energy. The color scale represents transmission change ΔT/T. b) The transient Raman spectra extracted from the line cuts (white dashed lines) shown in (a) at various probe energies. Red curves are fitted with Fano lineshapes based on equation 1. The right panel shows the evolution of the Raman quantum pathways |n〉 and excitonic Floquet band |X′〉. c) Measured exciton resonance (black circles) as a function of driving pump energy for a driving intensity of 0.7 GW cm−2. The dependence can be nicely described by an inverse proportional relationship (red line). The dashed line shows the calculated Raman scattering frequency E as as a function of pump energy. d) The Fano q‐factor extracted by fitting the Raman spectra based on Equation 1 (black circles) is in good agreement with the predictions based on Equation 2 (red solid line). e) Schematic diagram illustrating the effective coupling between the phonon Raman intermediate state |n〉 and excitonic Floquet states |X′〉 under driving pump irradiation. The interactions are governed by the electron‐phonon coupling constant Vk .
