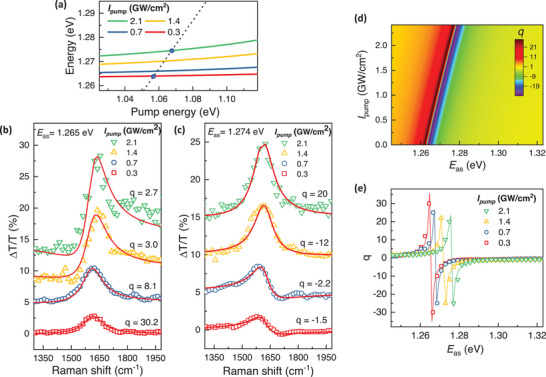
Figure 4.

Pump intensity dependence of Fano resonance. a) Calculated exciton resonance as a function of driving pump energy at different driving intensities I pump (solid lines). Depending on the pump intensity, the Raman scattering frequency E as (black dashed line) intercepts with the exciton resonance at different energies. The blue circles show the resonant Raman scattering conditions for driving pump intensities set to 0.3 and 2.1 GW cm−2. b, c) Driving pump intensity‐dependent Fano lineshapes at (b) E as = 1.265 eV and (c) E as = 1.274 eV. By controlling the driving pump intensity, the Fano lineshapes for a given E as varies from asymmetric dispersive feature to symmetric Lorentzian, corresponding to a change of interference parameter from |q| ≈ 1 to |q| ≫ 1. d) The Fano q‐parameter calculated based on Equation 2 for different driving pump intensities I pump. e) The Fano q‐parameter as a function of E as at different excitation intensities. Symbols are q values obtained from fitting the Raman spectra based on Fano lineshapes described in Equation 1 and solid lines are fitting based on Equation 2.
