
Figure 1.
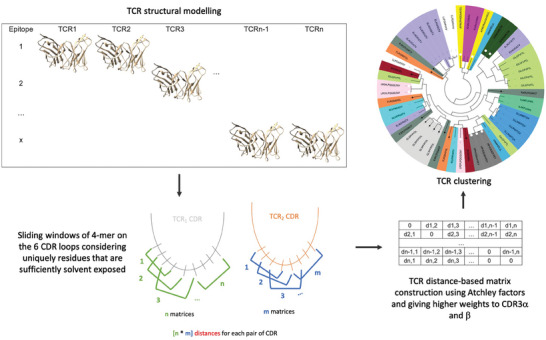
Representative scheme for the clustering pipeline used in TCRpcDist‐3D. The clustering pipeline consists of four main steps. First, all possible sliding windows of 4 residues that constitute the so‐called 4‐mer subunits are identified. The CDR residues that cannot directly contact the peptide, as determined by their solvent accessibility in the structural models, can be excluded from the process. Next, each 4‐mer subunit is converted into a biophysicochemical representation using 5 Atchley factors. For each CDR of a pair of TCRs, all the n 4‐mer motifs that are possible to construct from the first TCR with all the m possible 4‐mer motifs of the second TCR are compared. This results in n × m matrix comparisons for each CDR for each pair of TCRs. The matrix comparisons are performed via a Manhattan distance score normalized over the maximum possible distance. This score ranges from 0, for 4‐mers sharing the same biophysicochemical properties, to 1, for 4‐mers that have the highest difference in biophysicochemical properties. The method was developed using TCR‐pMHC PDB structures before being tested for use with TCR homology models for broader applications. The clustering accuracy is found maximal when a weighting of ≈30% is applied to the subset of amino acids in CDR3α or CDR3β and a weighting of 10% are given to the subset of amino acids in CDR1α, CDR2α, CDR1β, or CDR2β, respectively. The clustering accuracy is better when, together with the weighting factors, only residues sufficiently exposed to the solvent, thus potentially able to contribute to the pMHC binding interface, are part of the 4‐mers.