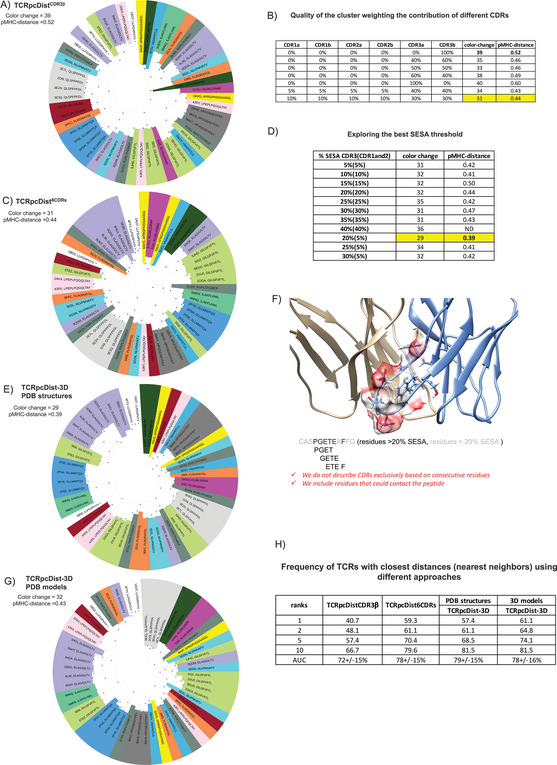
Figure 2.

TCRpcDist clustering TCRs and correlating with their specificity. A) shows hierarchical clustering of a set of 54 TCRs recognizing 16 different pMHC using the Atchley‐based distance considering only sliding windows of 4 consecutive residues of the CDR3β. After clustering, each TCR is colored according to the pMHC it binds. The sequence of the bound peptide is also given; B) quality of the cluster as measured by the number of color changes and the pMHC‐distance, for diverse weightings of the contributions of the various CDRs. The maximal clustering efficiency is highlighted in yellow and obtained when each CDR3s contribute by 30% and each of the remaining CDRs by 10% to the distance calculation; C) shows the hierarchical clustering of a set of 54 TCRs recognizing 16 different pMHC using the Atchley‐based distance considering all 6 TCR CDRs (i.e., CDR1α, CDR2α, CDR3α, CDR1β, CDR2β, and CDR3β). After clustering, each TCR is colored according to the pMHC it binds. The sequence of the bound peptide is also given; D) exploring the best nSESA threshold. The clustering efficiency as measured by the number of color changes and the pMHC‐distance is maximal when residues with nSESA < 5% in CDRs 1 and 2 and residues with nSESA < 20% in CDRs 3 are excluded from the distance calculation; E) shows hierarchical clustering of a set of 54 TCRs recognizing 16 different pMHC using the Atchley‐based distance considering all 6 TCR CDRs (i.e., CDR1α, CDR2α, CDR3α, CDR1β, CDR2β, and CDR3β), as well as residues buriedness calculated on the PDB structures. After clustering, each TCR is colored according to the pMHC it binds. The sequence of the bound peptide is also given; F) illustrates how solvent exposed residues are included in the distance calculation while buried residues are excluded (The TCR structure corresponds to PDB ID 4JRX); G) shows hierarchical clustering of a set of 54 TCRs recognizing 16 different pMHC using the Atchley‐based distance considering all 6 TCR CDRs (i.e., CDR1α, CDR2α, CDR3α, CDR1β, CDR2β, and CDR3β), as well as residues buriedness calculated on 3D models created by our pipeline that models TCRs from sequences. After clustering, each TCR is colored according to the pMHC it binds. The sequence of the bound peptide is also given; H) table shows how often a TCR with the same specificity is found in the top 1, 2, 5 and 10 TCRs with the closest distances using 4 versions of TCRpcDist (using just CDR3β, using all CDRs, using all CDRs + nSESA (residues buriedness) taken from PDB structures and using all CDRs + nSESA (residues buriedness) taken from 3D models constructed by our pipeline to model sequences). Area Under ROC curve (AUC) as a measure of accuracy and respective standard deviation is also presented.
