
Figure 7.
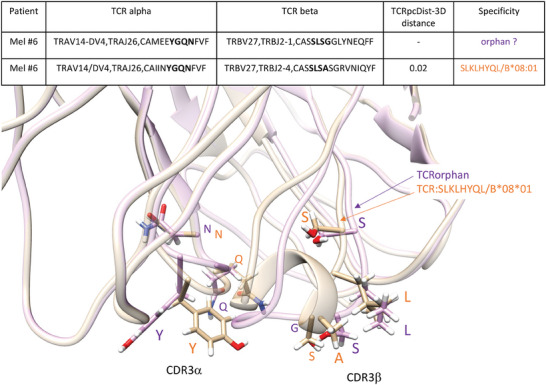
3D models superimposition of Mel#6 TCR specific for the neoAg SLKLHYQL/HLA‐B*08:01, in light brown with the orphan Mel#6 TCR with closest TCRpcDist‐3D distance, in light purple. Orphans and closest TCR are described in detail in Table 4. These TCRs exhibit a very small TCRpcDist‐3D distance, 0.02, since they share the same TRAV and TRBV and exhibit the same 4‐mer in CDR3α, YGQN, and nearly the same 4‐mer in CDR3β SLSA versus SLSG. The CDR3s 4‐mer features, highlighted in bold in the table and in sticks in the 3D models, are solvent exposed and able to interact with the peptide.