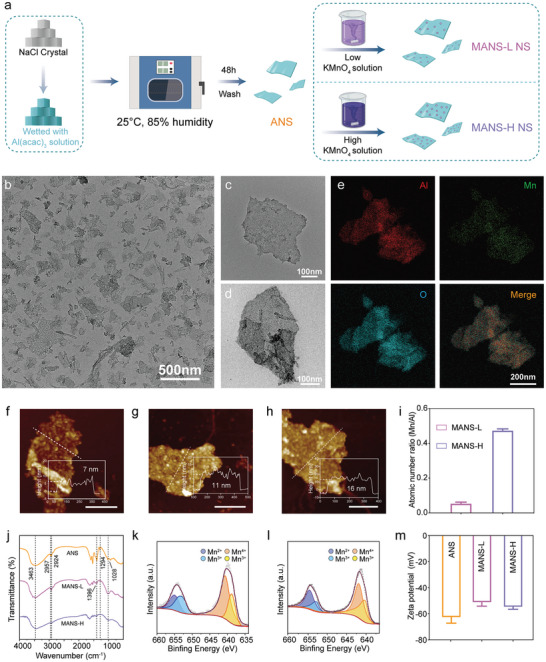
Figure 2.

Characterization of nanosheet adjuvants. a) Schematic illustration of the preparation of ANS, MASN‐L, and MANS‐H. b–d) TEM images of b) ANS, c) MANS‐L, and d) MANS‐H. e) The element mapping images of MANS‐H. f–h) AFM topography images and height profiles of f) ANS, g) MANS‐L, and h) MANS‐H. Scar bar: 200 nm. i) The atomic ratios of Mn/Al in MANS‐L and MANS‐H were determined by ICP analysis (n = 3). j) FTIR spectra of ANS, MANS‐L, and MANS‐H. k‐l) XPS spectra of k) MANS‐L and l) MANS‐H. m) Zeta potential values of ANS, MANS‐L, and MANS‐H in PBS solution (n = 3). Data are presented as mean ± SD (i and m).
